Aurora Australis 4
Credit here must go to Photo Pils for the bones of this post.
Essential Steps for Planning Your Auroral Photo Shoot
To see the Southern lights you have to plan carefully. This includes choosing the right time, place, and weather.
You need four main things in essence. All four really to be in your favour, but none are guaranteed!!
1- To be in a place that’s able to see the auroral oval. Not just the physical location, but how that location fits in with the strength of aurora that you might expect there. To know that, you will need some understanding what phase of the solar cycle we are in, and if this is the best time of year (ie if you have maximum darkness, +/or and seasonal bias).
2- To be really dark
3- The sky must be clear, so you’ll need to keep a close eye on the weather forecast.
4- The moon is not too bright
**************************
There are some great apps for planning Aurora photos. The two main aurora ones would be Glendale and Space Weather Live.
Glendale has more data, so can be a bit tricker knowing how to read it if you are learning.
Space Weather Live uses a very simple color code:
- Green: Low aurora activity.
- Yellow: Medium aurora activity.
- Red: The redder the plots get, the better is for aurora activity!
There are a few web links that I’ll often use too at different times:
There are also several Facebook pages dedicated to sharing photos and receiving alerts.
https://www.facebook.com/groups/NZaurora
https://www.facebook.com/groups/SouthernHemisphereAuroraGroup
https://www.facebook.com/groups/shagupyaarse
(despite the name, this is legit!!)
Click here to go back to the main blog page for other articles
**************************
Using Space Weather Live to find out the Aurora Forecast
How do you actually know when you’re going to get an Aurora and of how to read the different indicators?
Open the app up.
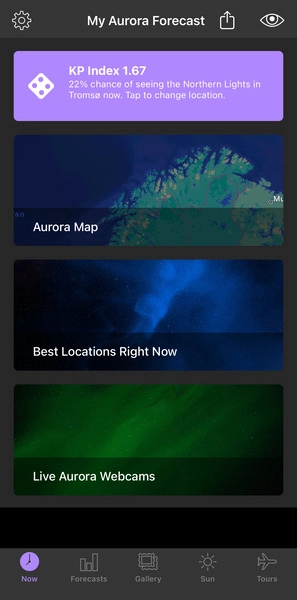
The first thing you see on the homepage is the Kp index, which is basically a measure of
- The size of the auroral oval.
- The strength of the solar storm.
It’s a 3-hour average and it’s a global average. So Kp is an interesting indicator, because it’s just an average of whats happened.
So it’s a very basic indicator. It doesn’t tell you about little sub storms that happen which could be stronger.
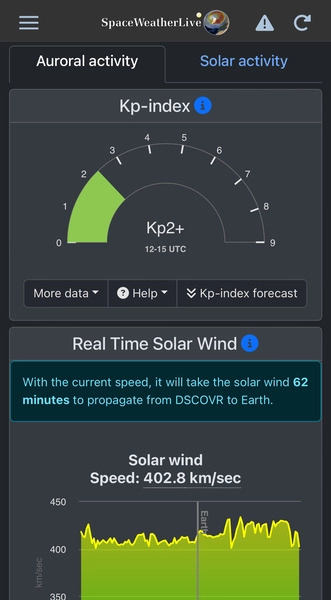
Space Weather Live – The home screen shows you the current Kp index.
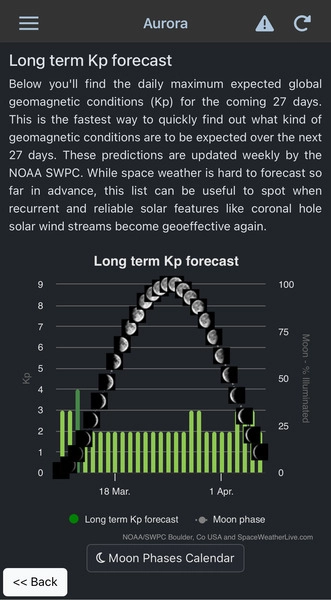
For here, you should have a look at a long term forecast. And that one will show you kind of maybe what’s expected over the next month.
To check it, tap More data > Aurora forecast.
Then, scroll down to the Long term Kp forecast chart.
However, take it with a grain of salt, because what the experts are basing that on is if you have an area of really high activity, like a coronal hole.
Coronal holes are the source of high speed solar wind streams. When these high speed streams arrive at Earth, they can produce active auroras.
The interesting thing is that a coronal hole can make more than one rotation. So as the sun rotates, you might see that again and again.
Now, go back to the homepage.
There, again, you can see the short term expected forecast for the next 3 days.
The app gives you a projected Kp forecast for a minimum and a maximum. And it also breaks it down into higher latitudes and mid latitudes.
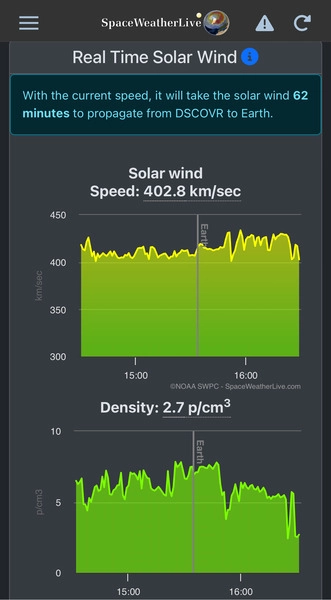
And while the Kp index gives you a quick indication of the strongest observed geomagnetic activity over a 3-hour period, the real time solar wind indicators is the really helpful bit.
Real time solar wind speed
The origin of Southern lights is basically gusts of solar wind.
Therefore, the solar wind is the first piece of the puzzle that you need to know about to predict whether there will be aurora activity or not at a certain date and time of the day.
In this sense, Space Weather Live has a solar wind chart indicating the speed. The higher the speed, the higher chances of having aurora activity. The target is a speed 400 km/sec+, 500+ even better.
But to make things easier, you don’t need to remember any numbers or ranges. Just look at the color!
Quick recap of Space Weather Live’s color code:
- Green: Low aurora activity.
- Yellow: Medium aurora activity.
- Red: The redder the plots get, the better is for aurora activity!
Real time solar wind density
The second piece of the puzzle you need to know about is the density of the solar wind.
The density of the solar wind is basically the number of solar wind particles per square centimeter.
But in terms of aurora activity, which is what matters to you, the higher the solar wind density, the higher the aurora activity. The target is a density 10 p/cm3 +.
Again, when looking at the Space Weather app, look at the color code 😉
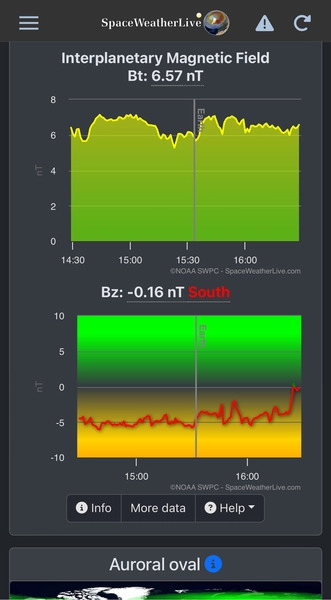
Space Weather Live – Keep scrolling down the home screen to see the interplanetary magnetic field variables.
Real time interplanetary magnetic field – Bt & Bz
The third & fourth piece of the puzzle you need to know about is the magnetic field of the Sun, also called interplanetary magnetic field (IMF).
OK, here’s a simple explanation. Charged particles can hold both an electric current and create a magnetic field. So as you can imagine, the charged particles given off by the Sun also hold a magnetic field. The particles stretch the magnetic field of the Sun around the planets. And this is what astronomers call the interplanetary magnetic field (IMF). The IMF value is a combined measure of the magnetic field strength in the north-south, east-west, and towards-Sun vs. away-from-Sun directions.
The see the best possible auroras you want that:
- The total strength of the interplanetary magnetic field (indicated with Bt) to be as high as possible (10+) and,
- The Z-component (Bz) of the interplanetary magnetic field towards the south. The stronger the negative value nT value to the south, the better. If it doesnt indicate south, I probably wouldn’t bother even going out myself if indicating north.
In other words
- Look for a high as possible Bt number.
- The longer the Bz stays south, the better.
These are 2 key indicators for me, as to whether or not I should go out and shoot.
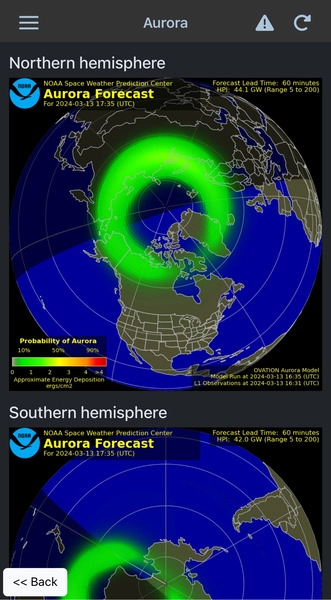
Don’t forget that the auroral oval is not a concentric circle – it’s pulled and twisted by our magnetic field lines.
So it actually moves around the Poles throughout time. And its size changes as well.
At Space Weather Live, you can have a look at NOAA ‘s auroral oval model. It gives you a short-term forecast of the intensity of the auroral oval for both the northern and the southern hemisphere.
So if a solar storm grows in intensity, that oval will actually get bigger and bigger.
From there you can set an alert on My Aurora Forecast
My Aurora Forecast – Tap the settings icon (gear) to adjust the notifications.
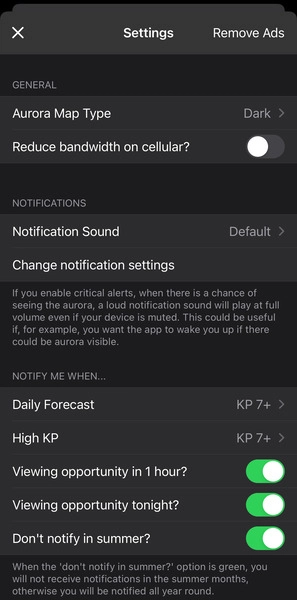
Then, select one of the models to access the forecast charts for temperature, humidity, and most importantly, precipitation and clouds.
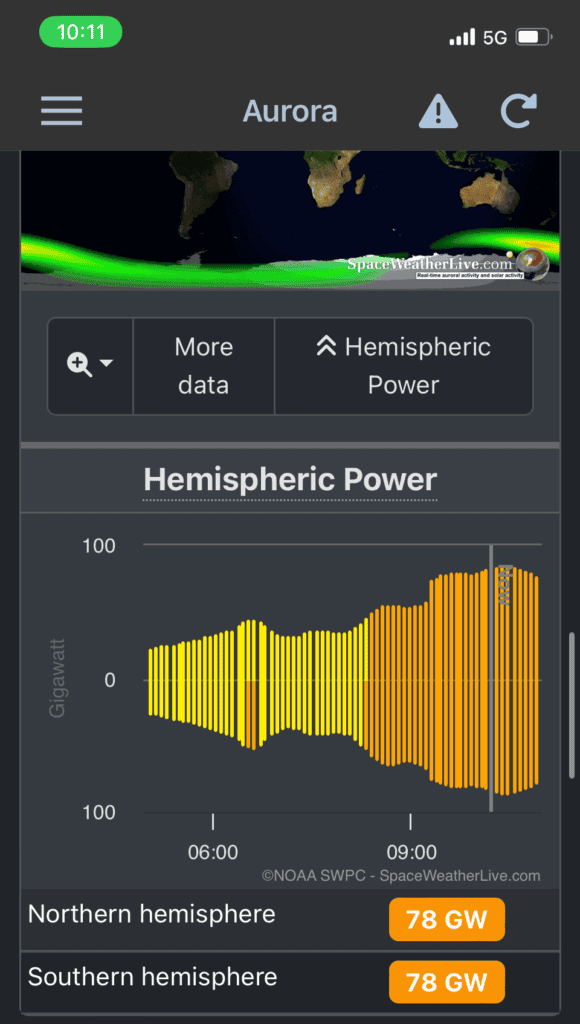
In addition, I would also take note of the Hemispheric power, measured in GW. Again, this tends to be colour coded as a guide for how serious things will get!
Another worthwhile check at this stage, would also be on a local K index. Essentially to see if there may be an imminent upswing of magnetometer activity known informally as the ‘Cloake Effect’.
It has been observed quite frequently, that as magnetic levels start to turn upwards after a sudden dip, that visible auroral activity noticably increases also. Again one of those things that is not fully understood, but first observed by Timaru photographer Geoff Cloake, and subsequently supported by the amateur observer community.
https://www.swpc.noaa.gov/products/goes-magnetometer

************************************
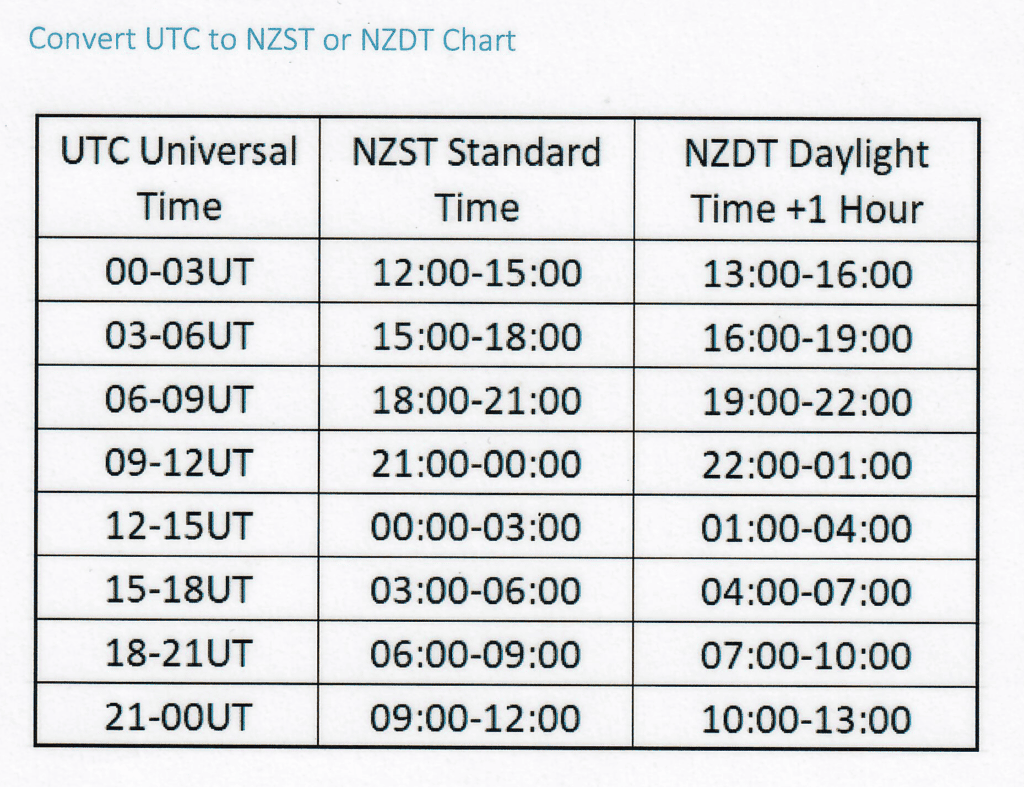
Another really confusing thing to get your head around, is the time used in many forecasts.
Usually these are given in UTC, which NZ is 12 hrs ahead normally, +13hrs during daylight saving.
*************************************************
In summary, here are the weather and aural forecast key indicators to bear in mind:
-
- Number of night hours. To capture auroras, you need a dark sky. This indicator tells you how long you can be shooting.
- Moon phase. The less light in the scene, the brighter you’ll see the northern lights. So shoot on a night around New Moon. If you want some Moonlight to illuminate the scene and your foreground, try to shoot with some Moon or even a Full Moon.
- Kp index. The higher the Kp index, the stronger the geomagnetic event (that is, the probability of having auroras). As noted previously, an adequate ‘broad’ tool.
- Solar wind speed. The start of more in depth analysis of data. Again, the higher the solar wind density, the higher the aurora activity. Aim 400+
- Solar wind density. Same thing here. The higher the solar wind density, the higher the aurora activity. Aim 10+
- Interplanetary magnetic field (Bt and Bz). You need both of these to be true:
- The total strength of the interplanetary magnetic field (indicated with Bt) to be as high as possible. Look for a high as possible Bt number.
- The Z-component (Bz) of the interplanetary magnetic field towards the south. The longer the Bz stays south, the better.
- Auroral oval. The bigger and brighter, the better.
- Weather forecast (precipitation and clouds). You need clear skies!
- Hemispheric Power
- Cloake Effect
- Time Difference / Forecast conversion