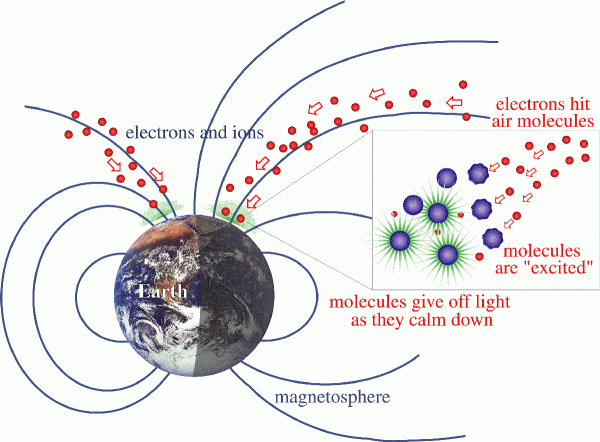
Aurora Australis 1
Last weekend (Sat May 11th 2024) was a huge weekend for aurora hunters like myself.
In a series of posts, I’ll do my best to explain some of this phenomenon, what causes the Aurora Australis (and Borealis), and how to photograph them.
So, What Causes the Aurora?
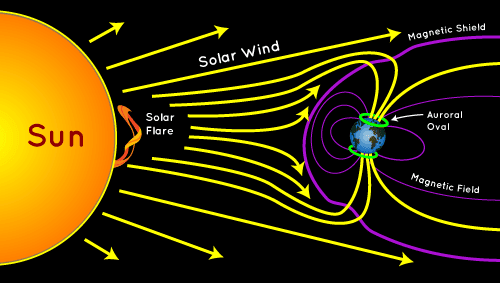
So What Causes an Increase in Solar Wind?
1) Coronal Mass Ejections (CME)
Coronal Mass Ejections (CMEs) are large expulsions of plasma and magnetic field from the Sun’s corona. They can eject billions of tons of coronal material and carry an embedded magnetic field (frozen in flux) that is stronger than the background solar wind interplanetary magnetic field (IMF) strength. CMEs travel outward from the Sun at speeds ranging from slower than 250 https://www.swpc.noaa.gov/phenomena/coronal-mass-ejections per second (km/s) to as fast as near 3000 km/s. The fastest Earth-directed CMEs can reach our planet in as little as 15-18 hours. Slower CMEs can take several days to arrive. They expand in size as they propagate away from the Sun and larger CMEs can reach a size comprising nearly a quarter of the space between Earth and the Sun by the time it reaches our planet.
The more explosive CMEs generally begin when highly twisted magnetic field structures (flux ropes) contained in the Sun’s lower corona become too stressed and realign into a less tense configuration – a process called magnetic reconnection. This can result in the sudden release of electromagnetic energy in the form of a solar flare; which typically accompanies the explosive acceleration of plasma away from the Sun – the CME. These types of CMEs usually take place from areas of the Sun with localized fields of strong and stressed magnetic flux; such as active regions associated with sunspot groups. CMEs can also occur from locations where relatively cool and denser plasma is trapped and suspended by magnetic flux extending up to the inner corona – filaments and prominences. When these flux ropes reconfigure, the denser filament or prominence can collapse back to the solar surface and be quietly reabsorbed, or a CME may result. CMEs travelling faster than the background solar wind speed can generate a shock wave. These shock waves can accelerate charged particles ahead of them – causing increased radiation storm potential or intensity.
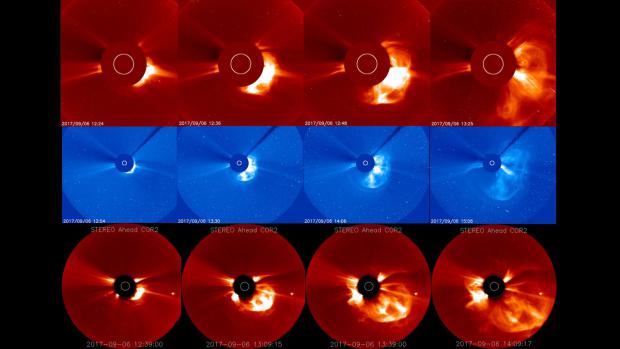
Important CME parameters used in analysis are size, speed, and direction. These properties are inferred from orbital satellites’ coronagraph imagery by SWPC forecasters to determine any Earth-impact likelihood. The NASA Solar and Heliospheric Observatory (SOHO) carries a coronagraph – known as the Large Angle and Spectrometric Coronagraph (LASCO). This instrument has two ranges for optical imaging of the Sun’s corona: C2 (covers distance range of 1.5 to 6 solar radii) and C3 (range of 3 to 32 solar radii). The LASCO instrument is currently the primary means used by forecasters to analyze and categorize CMEs; however another coronagraph is on the NASA STEREO-A spacecraft as an additional source.
Imminent CME arrival is first observed by the Deep Space Climate Observatory (DSCOVR) satellite, located at the L1 orbital area. Sudden increases in density, total interplanetary magnetic field (IMF) strength, and solar wind speed at the DSCOVR spacecraft indicate arrival of the CME-associated interplanetary shock ahead of the magnetic cloud. This can often provide 15 to 60 minutes advanced warning of shock arrival at Earth – and any possible sudden impulse or sudden storm commencement; as registered by Earth-based magnetometers.
Important aspects of an arriving CME and its likelihood for causing more intense geomagnetic storming include the strength and direction of the IMF beginning with shock arrival, followed by arrival and passage of the plasma cloud and frozen-in-flux magnetic field. More intense levels of geomagnetic storming are favored when the CME enhanced IMF becomes more pronounced and prolonged in a south-directed orientation. Some CMEs show predominantly one direction of the magnetic field during its passage, while most exhibit changing field directions as the CME passes over Earth. Generally, CMEs that impact Earth’s magnetosphere will at some point have an IMF orientation that favors generation of geomagnetic storming. Geomagnetic storms are classified using a five-level NOAA Space Weather Scale. SWPC forecasters discuss analysis and geomagnetic storm potential of CMEs in the forecast discussion and predict levels of geomagnetic storming in the 3-day forecast.
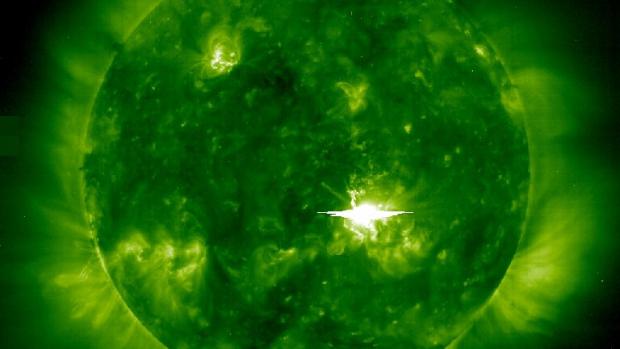
Solar Flares (Radio Blackouts)
Solar flares are large eruptions of electromagnetic radiation from the Sun lasting from minutes to hours. The sudden outburst of electromagnetic energy travels at the speed of light, therefore any effect upon the sunlit side of Earth’s exposed outer atmosphere occurs at the same time the event is observed. The increased level of X-ray and extreme ultraviolet (EUV) radiation results in ionization in the lower layers of the ionosphere on the sunlit side of Earth. Under normal conditions, high frequency (HF) radio waves are able to support communication over long distances by refraction via the upper layers of the ionosphere. When a strong enough solar flare occurs, ionization is produced in the lower, more dense layers of the ionosphere (the D-layer), and radio waves that interact with electrons in layers lose energy due to the more frequent collisions that occur in the higher density environment of the D-layer. This can cause HF radio signals to become degraded or completely absorbed. This results in a radio blackout – the absence of HF communication, primarily impacting the 3 to 30 MHz band. The D-RAP (D-Region Absorption Prediction) product correlates flare intensity to D-layer absorption strength and spread.
Solar flares usually take place in active regions, which are areas on the Sun marked by the presence of strong magnetic fields; typically associated with sunspot groups. As these magnetic fields evolve, they can reach a point of instability and release energy in a variety of forms. These include electromagnetic radiation, which are observed as solar flares.
Solar flare intensities cover a large range and are classified in terms of peak emission in the 0.1 – 0.8 nm spectral band (soft x-rays) of the NOAA/GOES XRS. The X-ray flux levels start with the “A” level (nominally starting at 10-8W/m2). The next level, ten times higher, is the “B” level (≥ 10-7 W/m2); followed by “C” flares (10-6 W/m2), “M” flares (10-5 W/m2), and finally “X” flares (10-4 W/m2).
Radio blackouts are classified using a five-level NOAA Space Weather Scale, directly related to the flare’s max peak in soft X-rays reached or expected. SWPC currently forecasts the probability of C, M, and X-class flares and relates it to the probability of an R1-R2, and R3 or greater events as part of our 3-day forecast and forecast discussion products. SWPC also issues an alert when an M5 (R2) flare occurs.
The table below provides the correlation between radio blackouts, solar flares, nominal energy flux (watts per square meter), and the designated severity event descriptor
Radio Blackout….. X-ray Flare….. Flux (W/m2)….. Severity Descriptor
R1 M1 0.00001 Minor
R2 M5 0.00005 Moderate
R3 X1 0.0001 Strong
R4 X10 0.001 Severe
R5 X20 0.002 Extreme