Aurora Australis 6
Aurora Sat May 11th 2024 Lead Up
So a couple of days out, I thought these alerts are starting to ramp up, and could turn into something serious.
Until now I have to say I have been a bit disappointed with the lack of display, given we are headed right into the crest of the current solar cycle (#25).
I could see late in the week here was increased auroral activity forecast, which given solar phase and seasonal equinox, all sounded promising. Being on the winter side of daylight saving and quite dark early, I knew too that was good news. I could see that the sky was looking to clear, and weather was looking on side. Added to that, the moon phase was not at all bright. Woohoo!!
So in all, I was on standby and quietly hopeful for Thurs / Fri.
Fri night levels were actually pretty amazing and I thought if that was the entree, Sat was actually going to be a blinder. I actually made a Facebook post to friends, suggesting if anyone was interested, that Sat night could be worth a look. It isn’t often it is warm enough, and not too late, so if it doesn’t kick off, it doesn’t really matter.
It turns out that at its peak, last week’s geomagnetic storm reached the highest possible level on the G-scale (Extreme – G5), making this the first G5 storm since 2003.

The CMEs that caused last week’s spectacular auroral displays originated from a cluster of sunspots designated Sunspot Region 3664, a region which also produced significant solar flares during the same period. At one point last week, this massive and complex sunspot cluster was about 17 times the diameter of Earth. It was like wave after wave of ejections and flares combined to make for a full earth bound punch.
According to NOAA’s Space Weather Prediction Center, a solar flare with a magnitude of X8.7 has since been detected from Sunspot Region 3664, at 1651 UTC on May 14. X-Class flares are the strongest of four categories and this X8.7 flare is stronger than anything measured last week. So as the sun turns away from Earth, this activity is likely to linger further. The question is, is the initial sunspot, and subsequent going to last long enough for a second blow as the rotation comes back round to face us in a few weeks/!
In fact, it’s the strongest solar flare detected in the current solar cycle, which begun in 2019 and is expected to peak next year.
It was enough for Transpower to suspend part of its power grid, knowing a similar event damage lines in Quebec in 1989. Though still comes short of what is regarded as the most severe solar event in modern history – the Carrington Event of 1859.
The current solar cycle is expected to peak in 2025 before declining over the next 5 to 7 years. Sunspot activity will remain elevated around the solar cycle’s peak, maintaining an elevated likelihood of aurora displays on Earth.
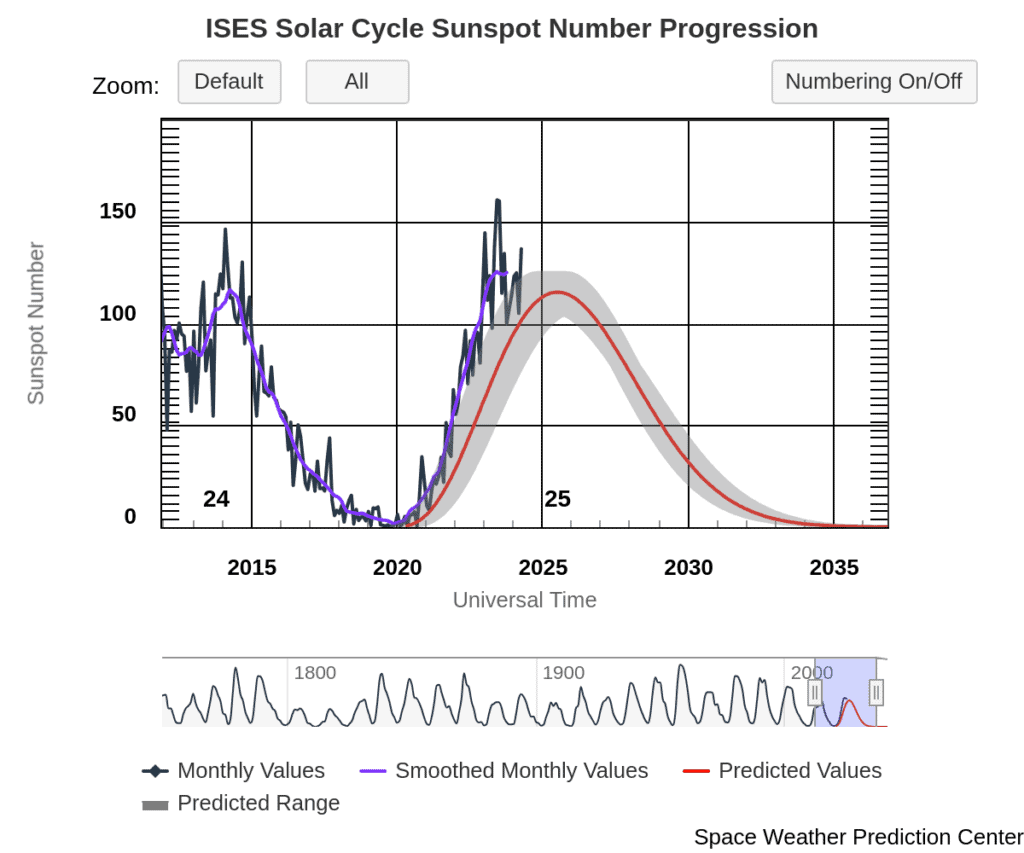
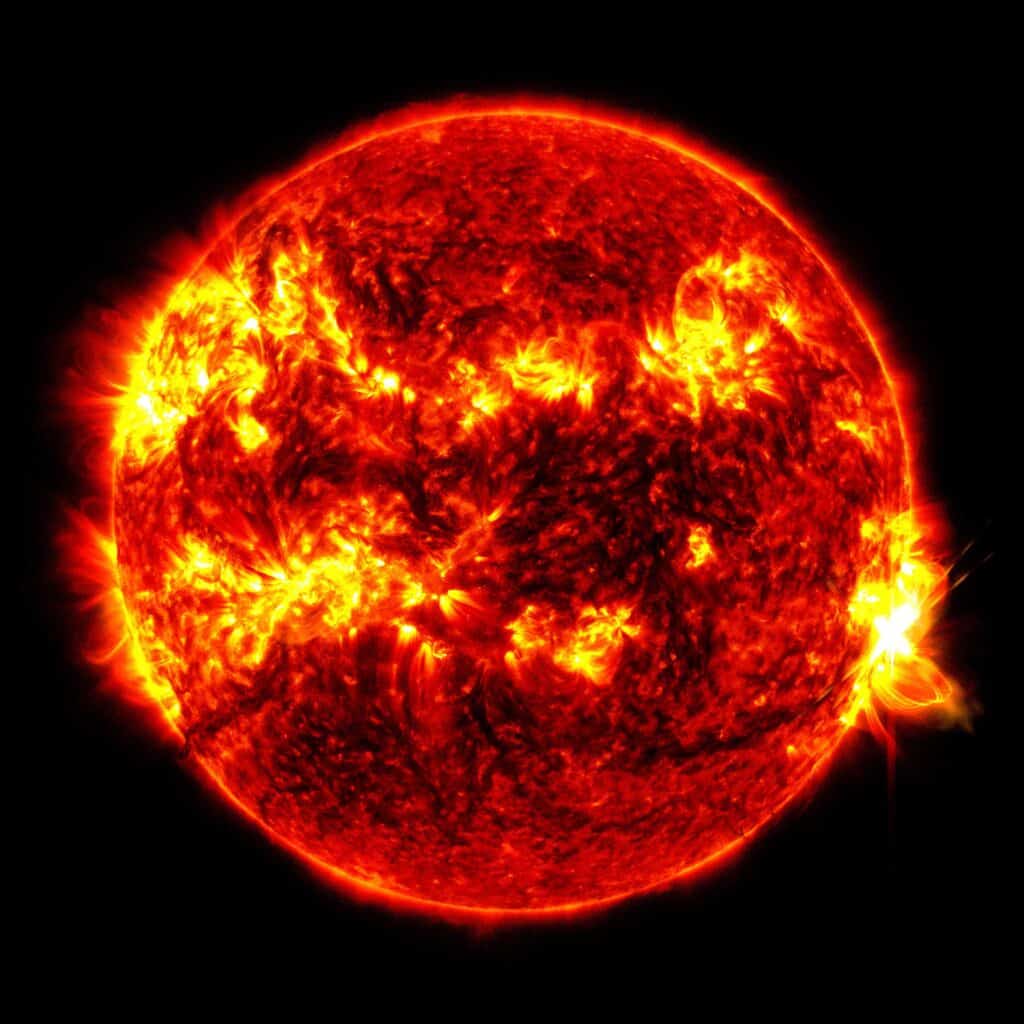
Image: The X8.7 solar flare – as seen in the bright flash on the right – on May 14, 2024. Credit: NASA/SDO
So I was actually very excited at the thought of a ‘big one’. I packed my kit, charged batteries, checked my torch(s), filled the car with fuel in eager anticipation. I set up at Tumbledown Bay, on Banks Peninsula. South facing views, right to the Southern Ocean, with foreground interest, away from city lights. I arrived early, knowing where I wanted to be, as well as keeping myself safe as the walk out on the cliff edge is a bit precarious! I set up in daylight and waited. Other people came after, and things slowly darkened after a stunning sun set.
As soon as it got dark enough to clear the sunset around 6.40pm, the aurora was on. It was there waiting doing its thing the whole time, the biggest and brightest I have ever seen. By actual darkness at 7pm, it was punching. Clearly visible with the naked eye, with pillars, waves and a overall glowing dome nearly 180degress West to East.
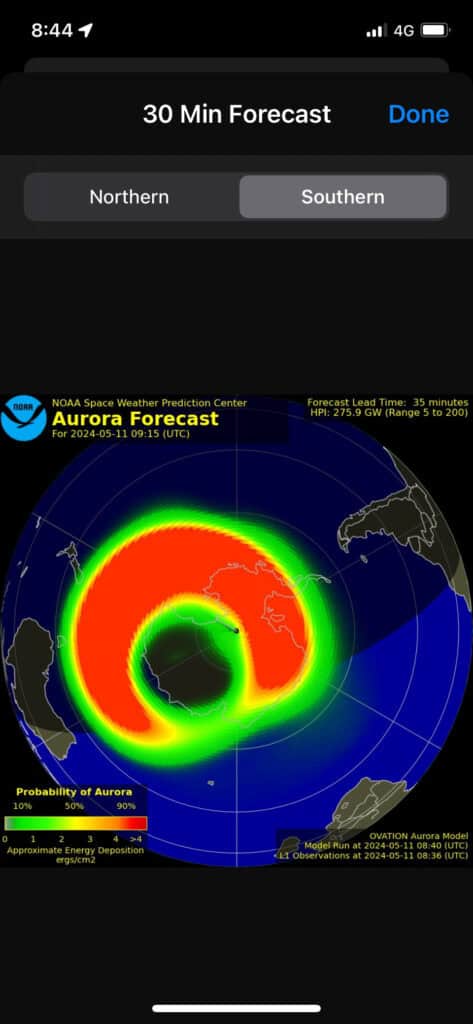
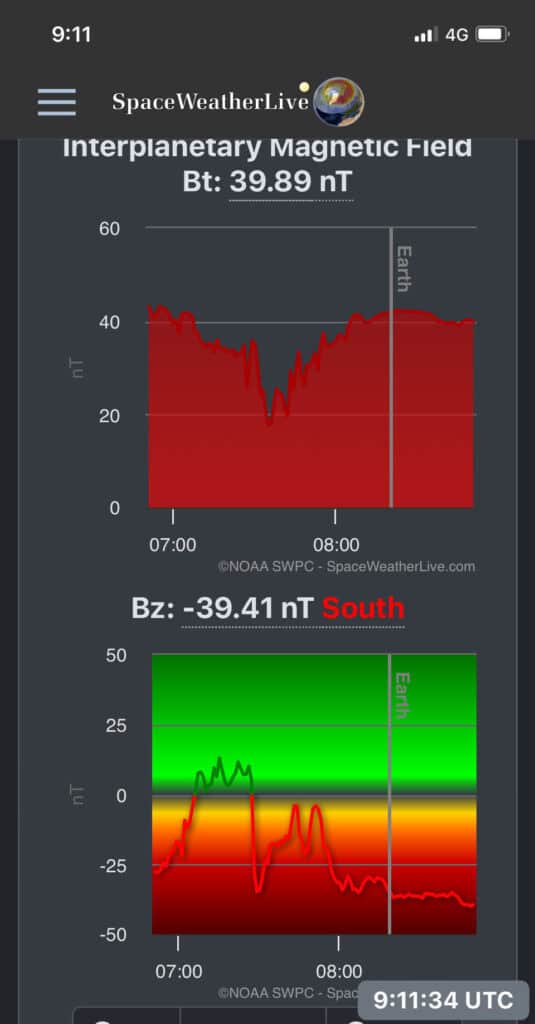
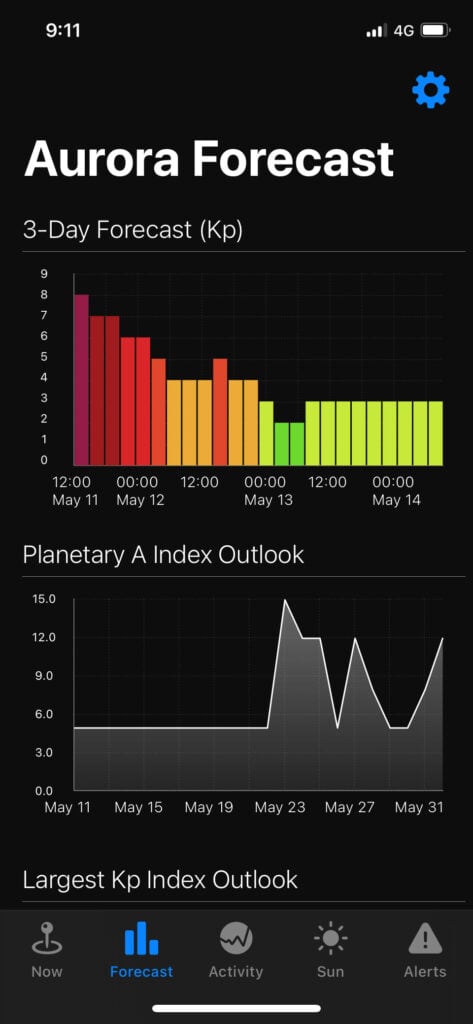
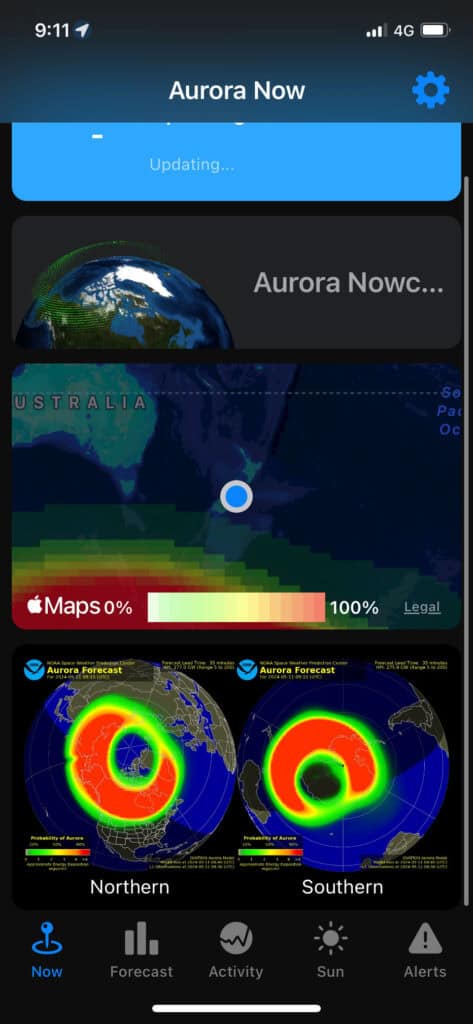
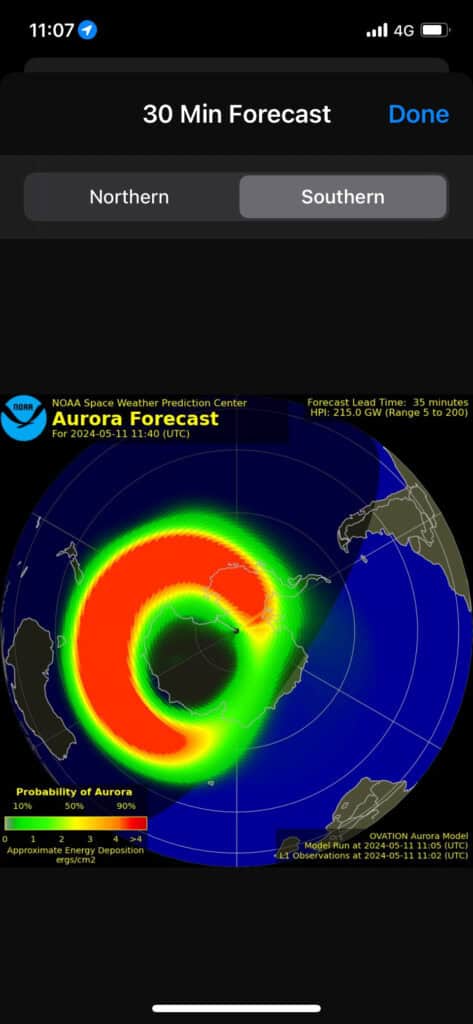
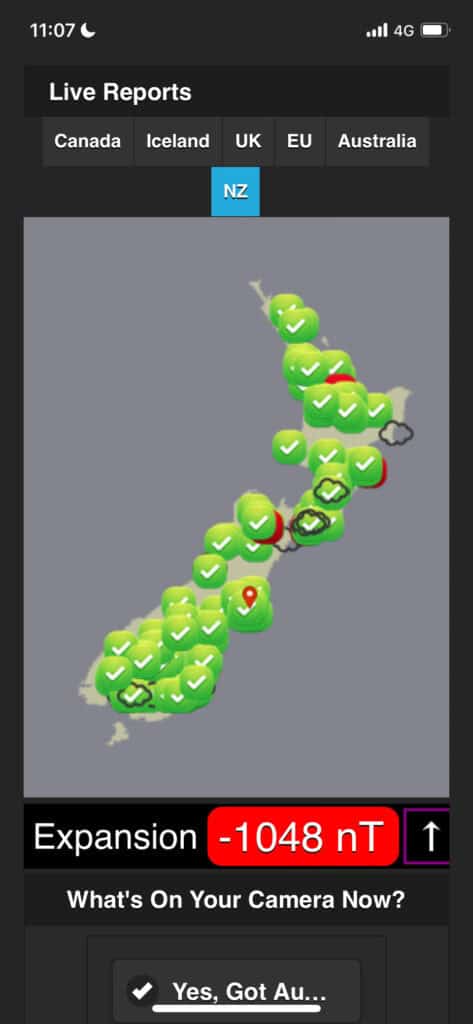
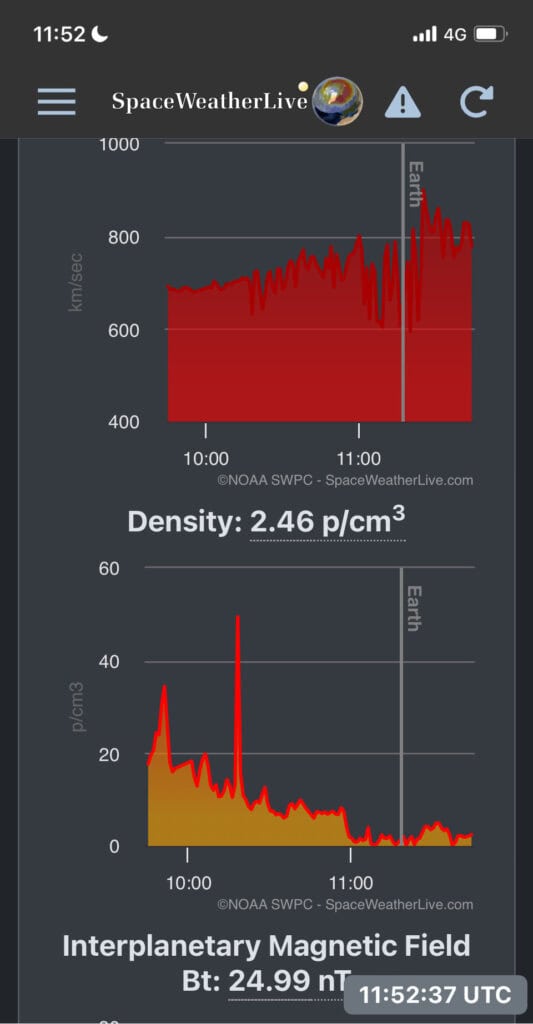
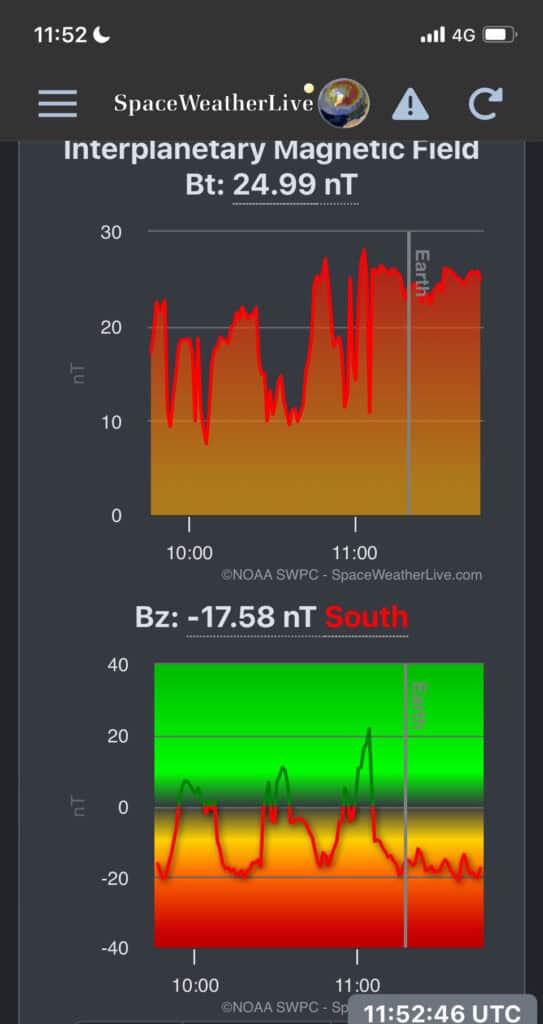
You can see here some of the app readings just before / after 9pm.
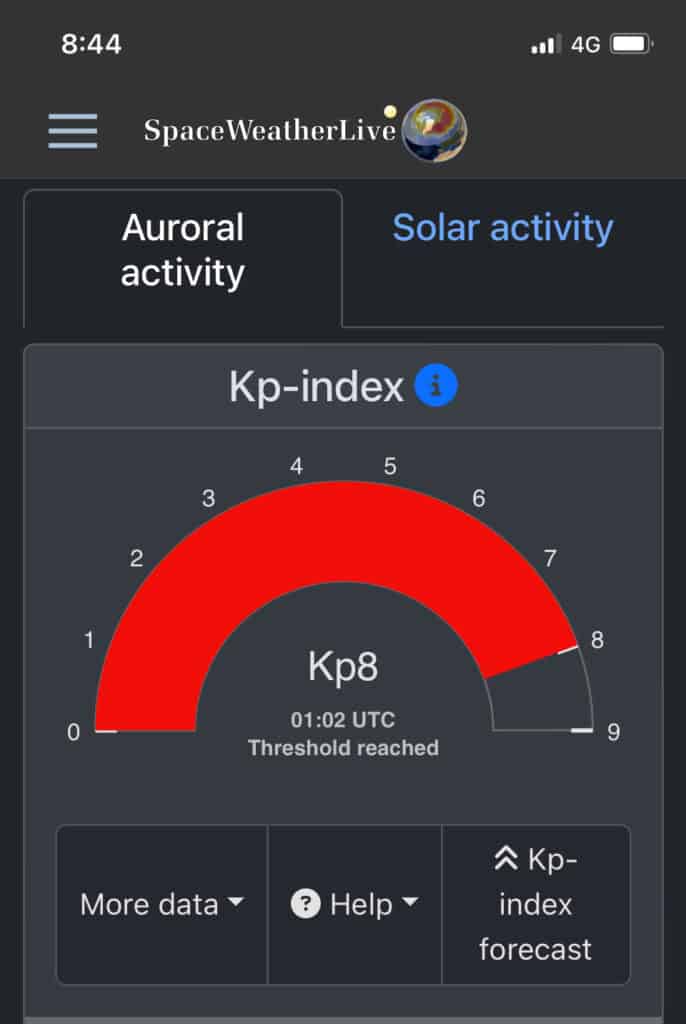
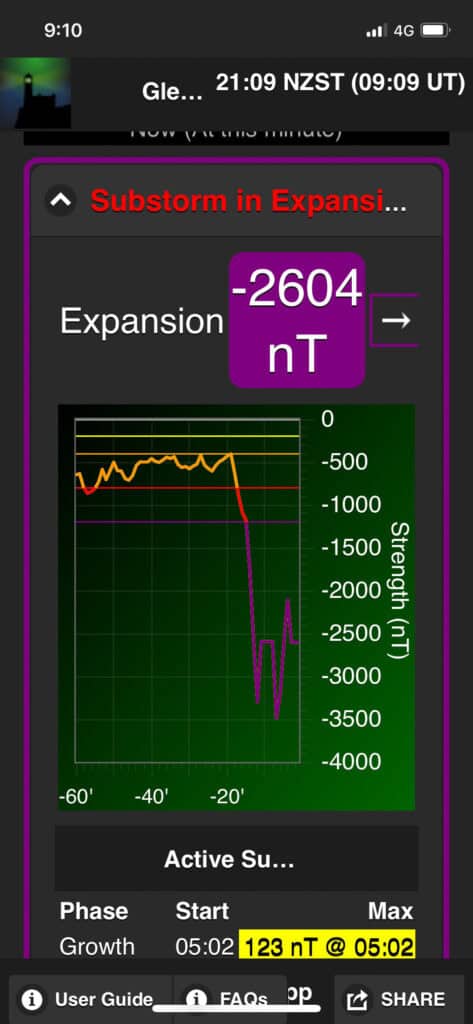
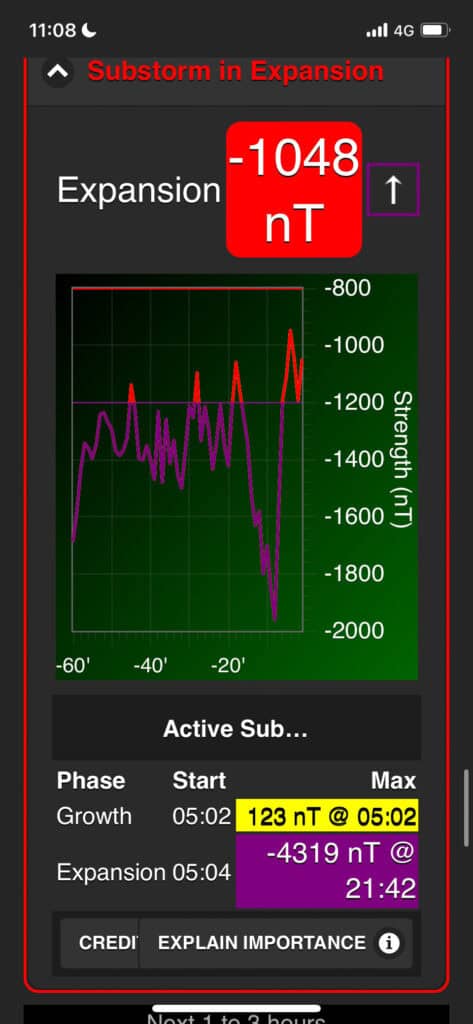
Then again after 11pm

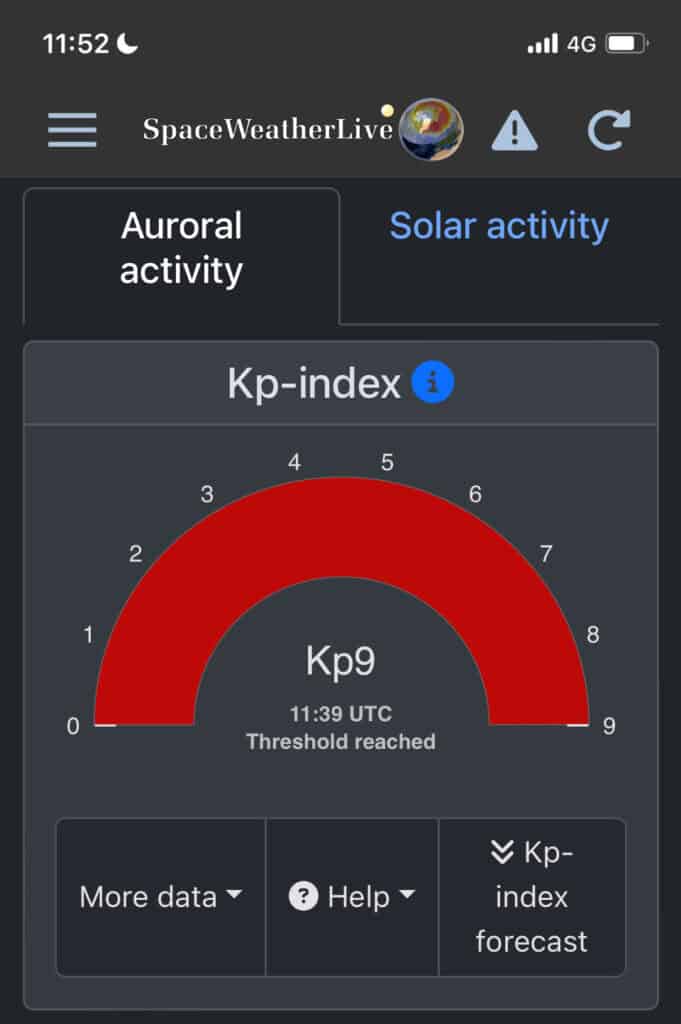
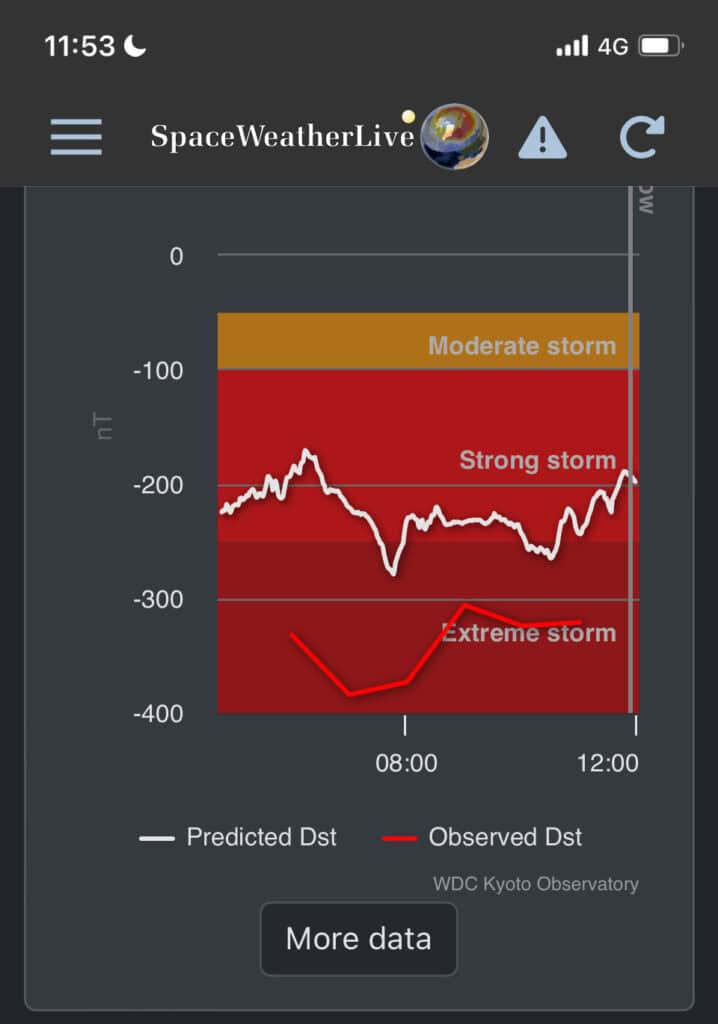
But then at close to midnight we got a Kp9!
Reviewing the Data in Hindsight
Writing this nearly one week on, we have a bit more information.
From May 3 through May 9, 2024, NASA’s Solar Dynamics Observatory observed 82 notable solar flares. The flares came mainly from two active regions on the Sun called AR 13663 and AR 13664. This video highlights all flares classified at M5 or higher with nine categorized as X-class solar flares.
NASA’s Goddard Space Flight Center
Traveling at speeds up to 3 million mph, the CMEs bunched up in waves that reached Earth starting May 10, creating a long-lasting geomagnetic storm that reached a rating of G5 — the highest level on the geomagnetic storm scale, and one that hasn’t been seen since 2003.“The CMEs all arrived largely at once, and the conditions were just right to create a really historic storm,” said Elizabeth MacDonald, NASA heliophysics citizen science lead and a space scientist at NASA’s Goddard Space Flight Center in Greenbelt, Maryland.
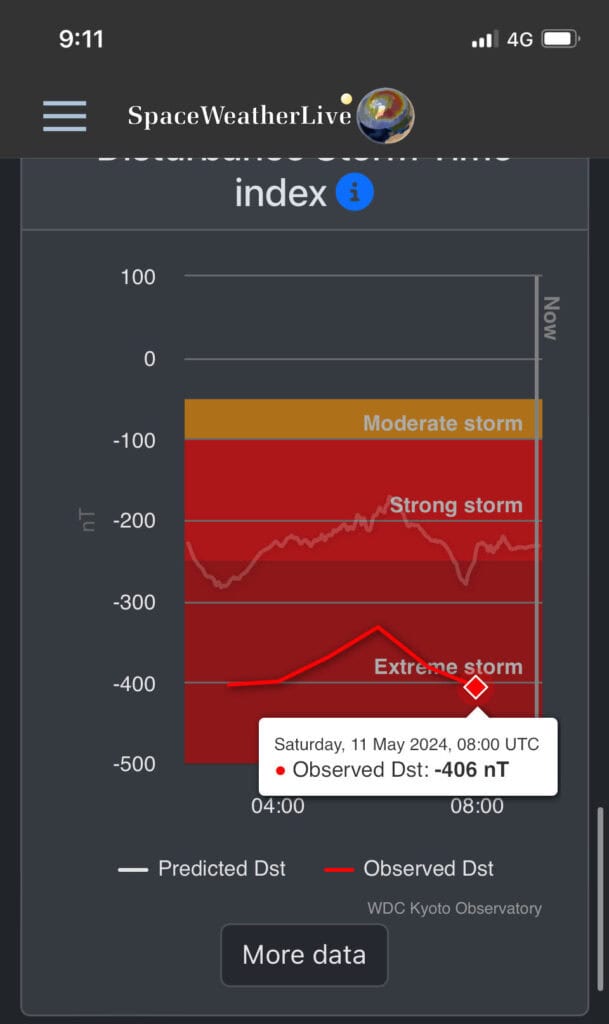
By one measure of geomagnetic storm strength, called the disturbance storm time index which dates back to 1957, this storm was similar to historic storms in 1958 and 2003. And with reports of auroras visible to as low as 26 degrees magnetic latitude, this recent storm may compete with some of the lowest-latitude aurora sightings on record over the past five centuries, though scientists are still assessing this ranking.
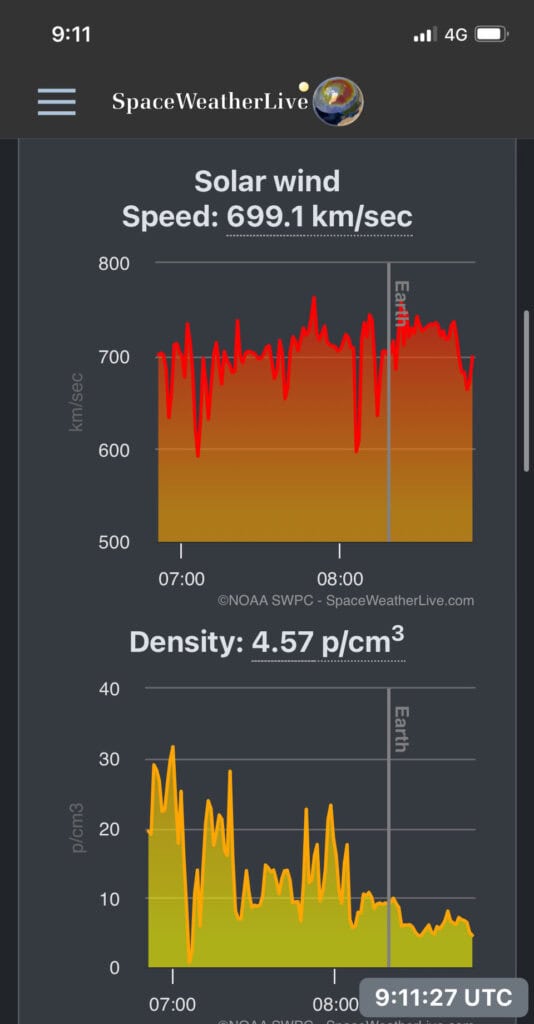
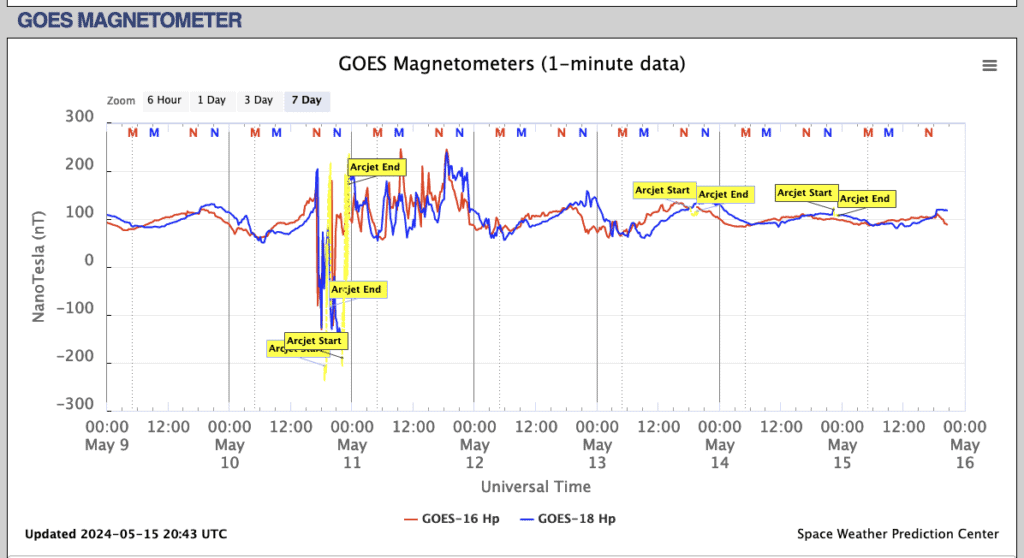
You can see the Magnetometer readings (note in UTC time, not NZDT).
Also written in hindsight of the event, the week later, Benjamin Alldridge wrote on the Southern Hemisphere Aurora Group Facebook page
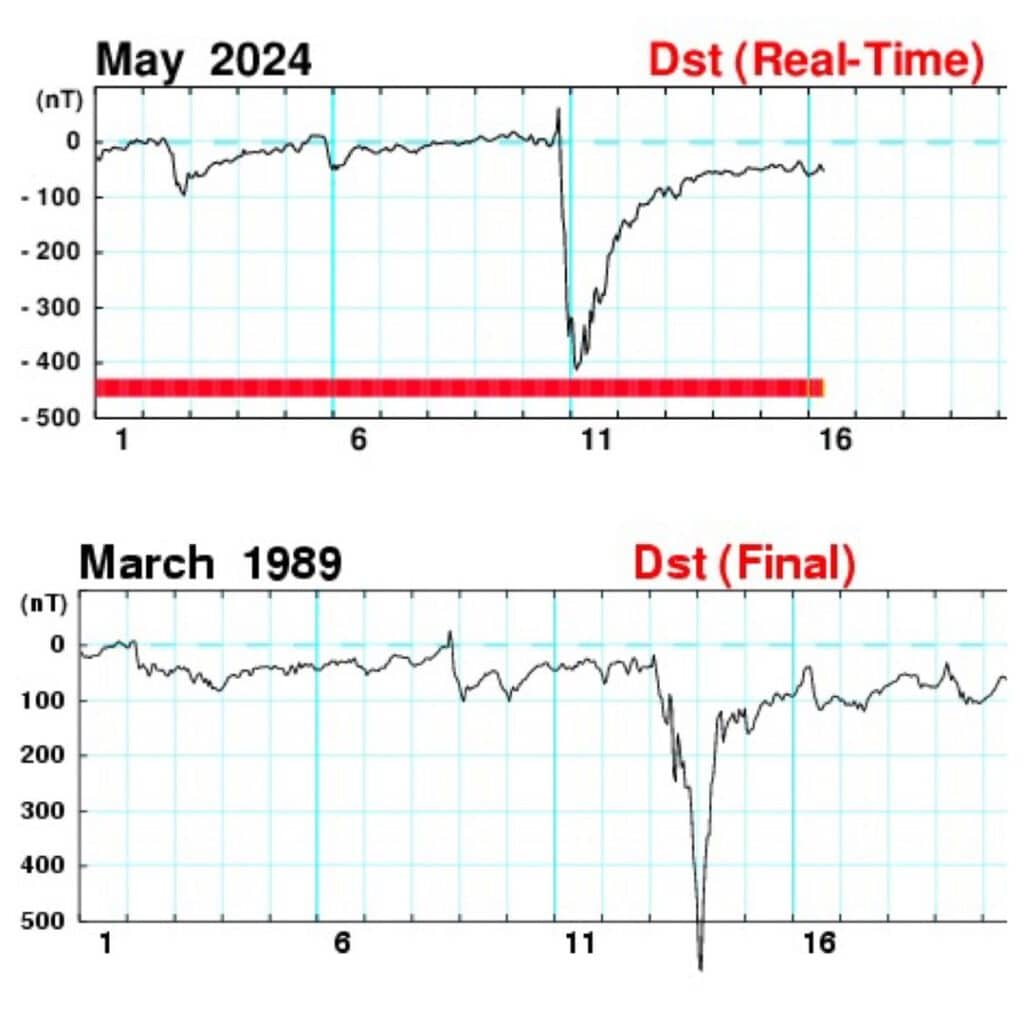
“Those of you who caught the majesty of the aurora: you have witnessed once in a century conditions. Last time we had this level of activity in one 24 hour period was early in the last century. In terms of absolute magnitude, we peaked at -412nT DST (essentially the level of “agitation” the magnetosphere has experienced), the greatest since the 1989 solar storms that took down the entire power grid of Quebec, which was on paper about 20% bigger but lasted for a shorter amount of time. We had confirmed captures in FNQ near Cairns, New Caledonia, and Florida – about 6,000km from the geomagnetic poles. People captured it in most major cities on the planet, and saw it clearly in many others. Even Africa and South America didn’t miss out, which is unprecedented in modern times”.
I have since read another post by Ian Cooper on the Aurora Australis NZ Facebook page, that I will post and credit fully here:
Posted on 22/05/2024, Ian Cooper, Astronomer, Aurora Australis NZ Facebook page.