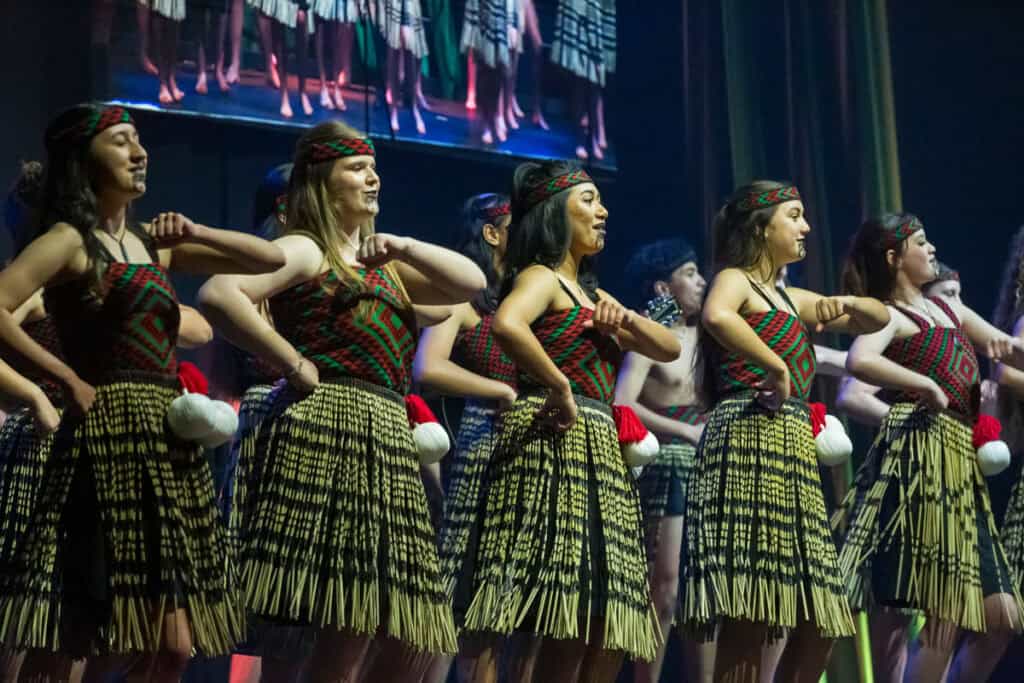
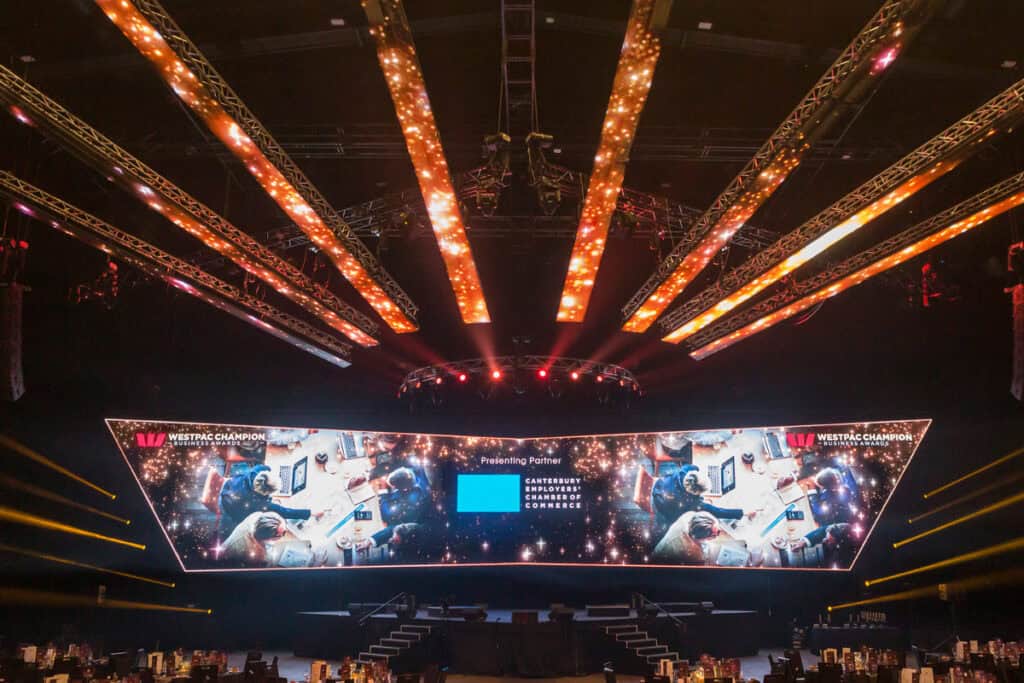
I get asked to photograph many functions, and this genre is a big part of what I do. Just what I produce, will depend on just what the client needs. While each event will have its own ‘flavour’, there are certainly many commonalities.
Whether it is a corporate mix and mingle, an industry awards night, or fundraising dinner, it will ultimately come down to what the client requires. It is my experience there are several common requests, that will cover off most requirements for most events that I photograph.
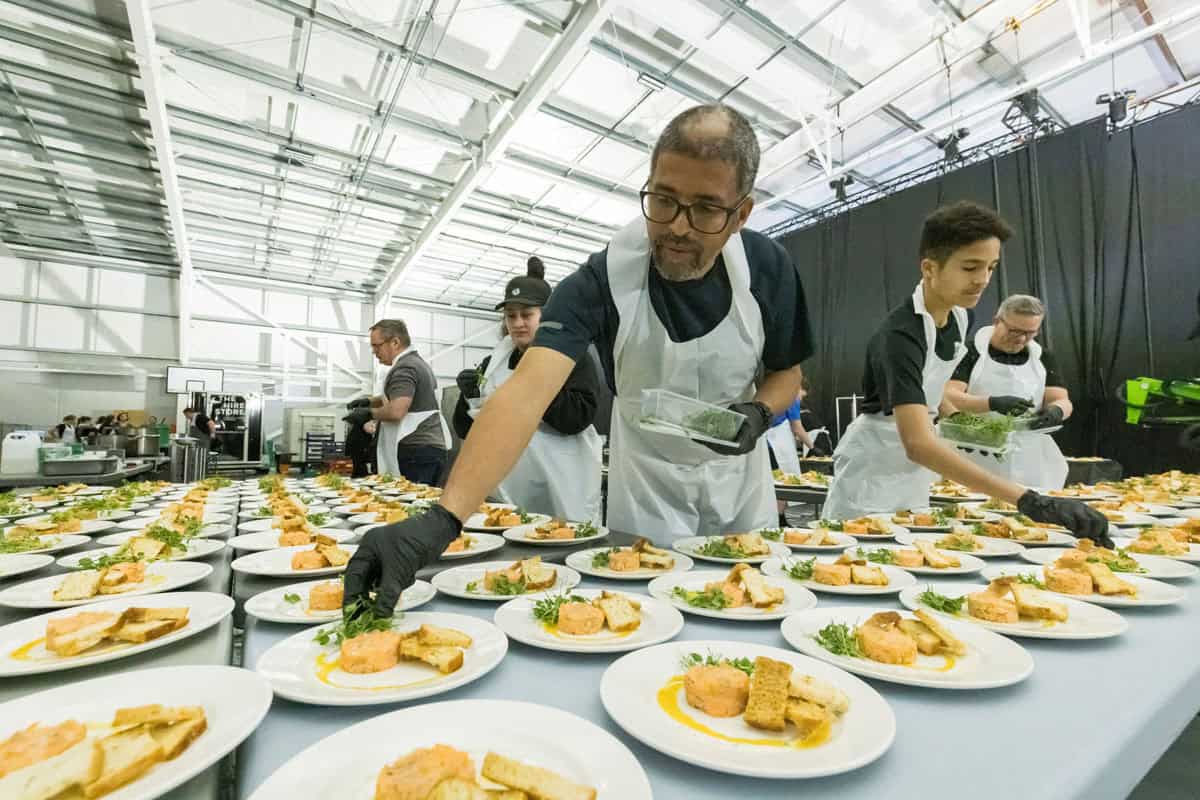
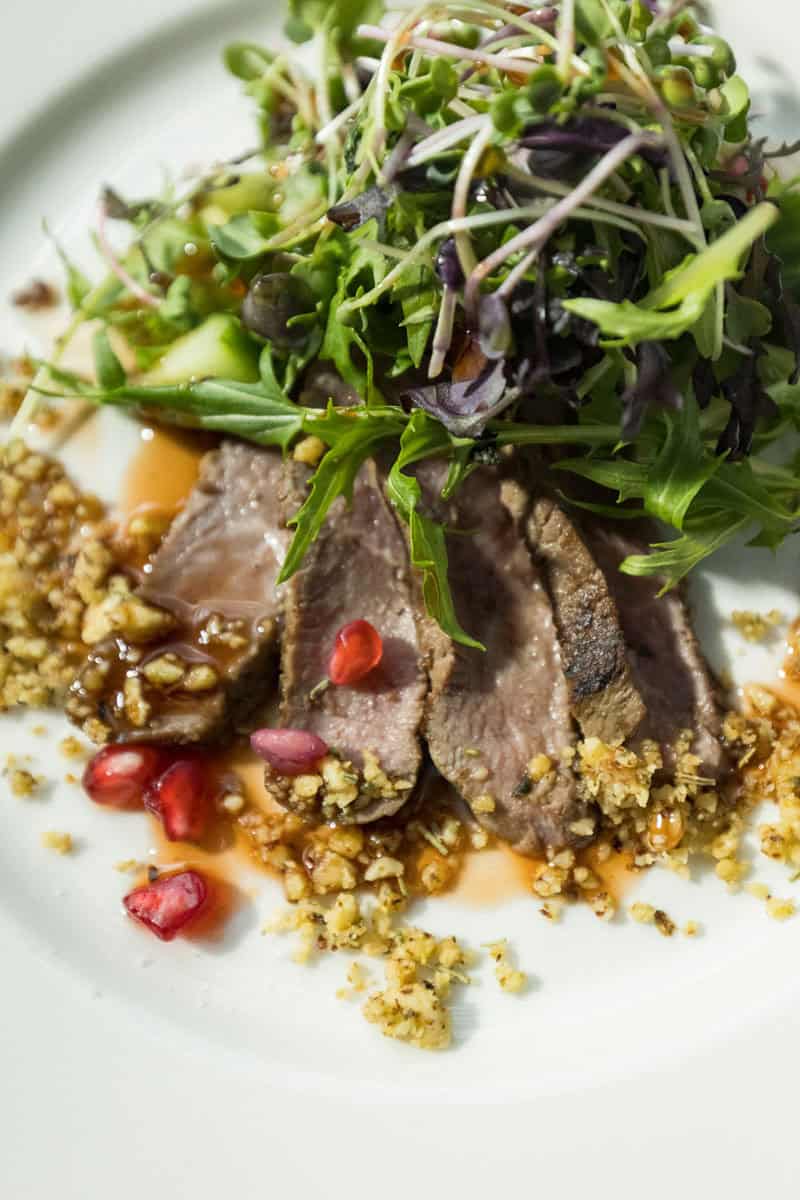
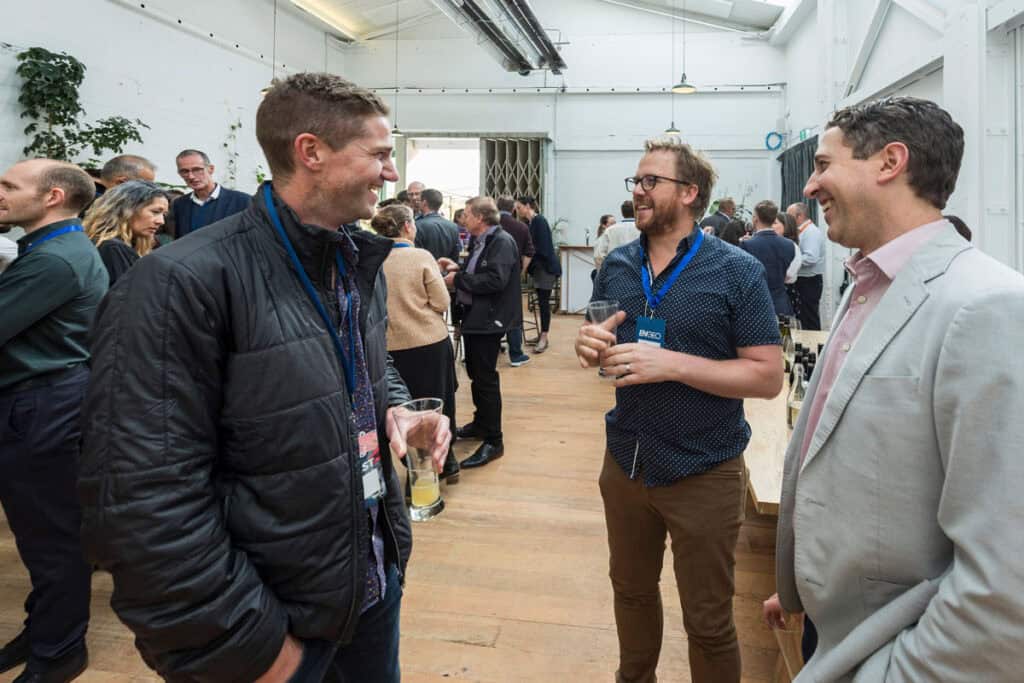
a) Produce a record of the occasion, with everyone who was there, the food, the entertainment…
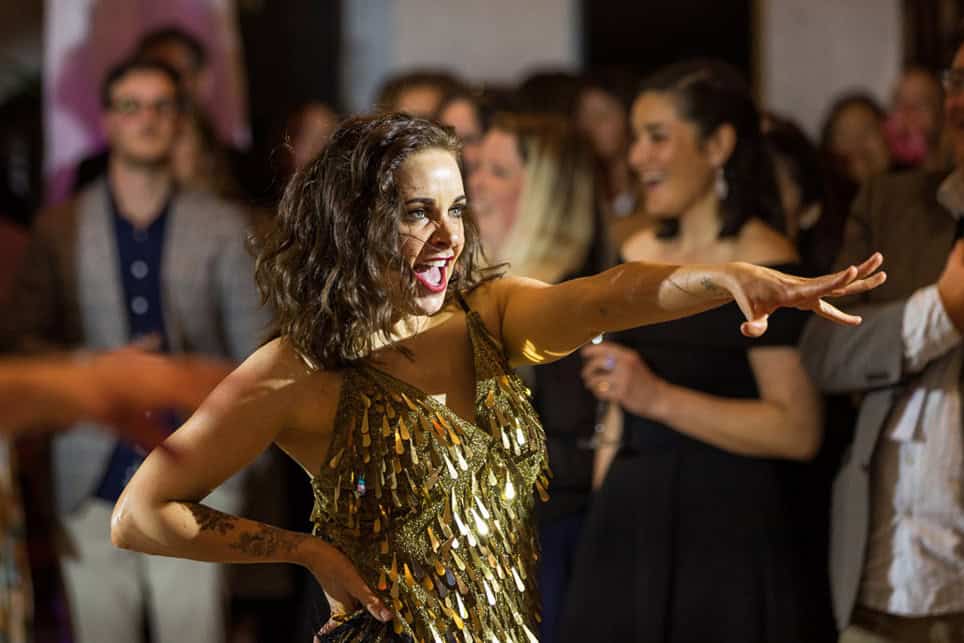
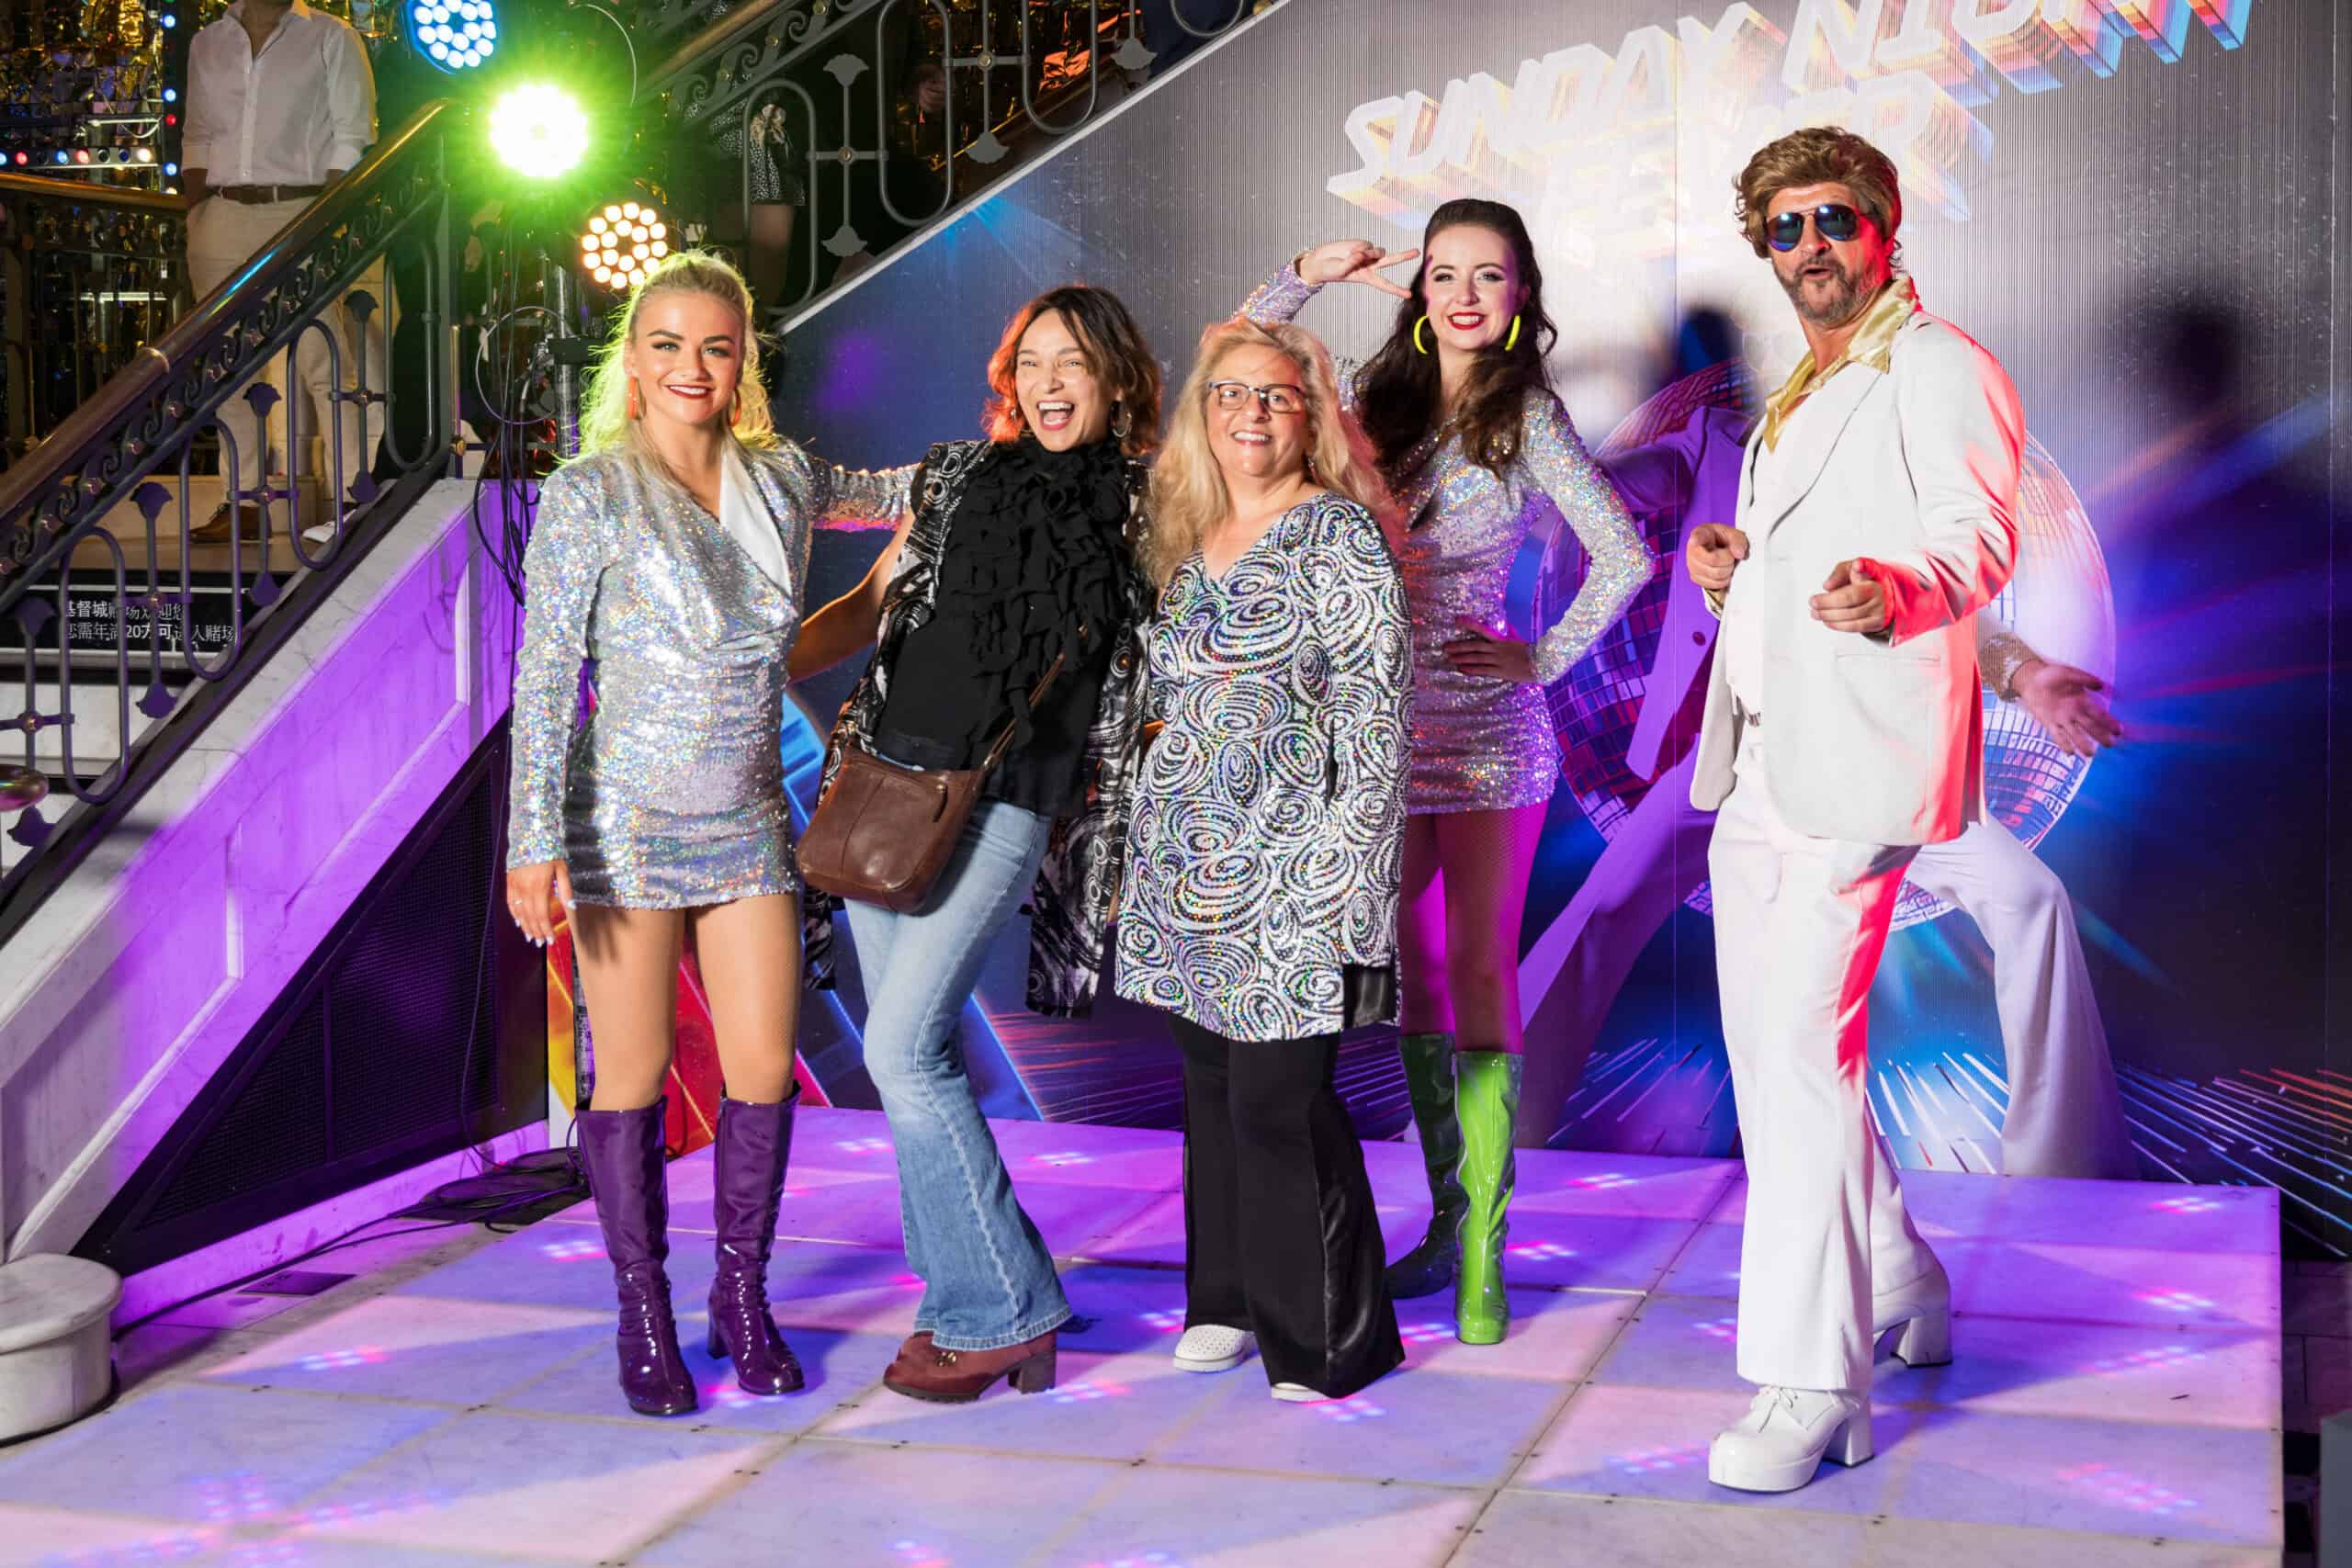
b) Produce material for social media or newsletters, showing how much people enjoyed themselves!
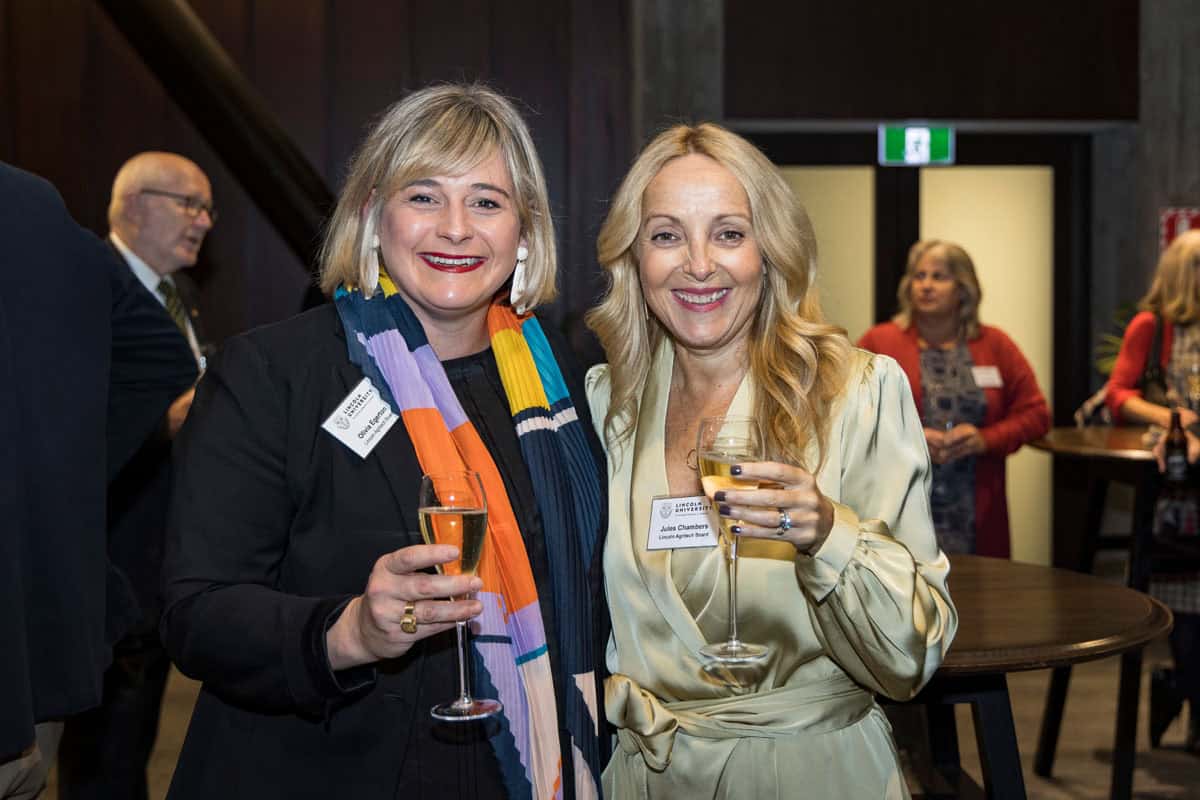
It’s about happy people, and how well they were looked after (before they REALLY start enjoying themselves, if you know what I mean, when there’s an open bar!!!).
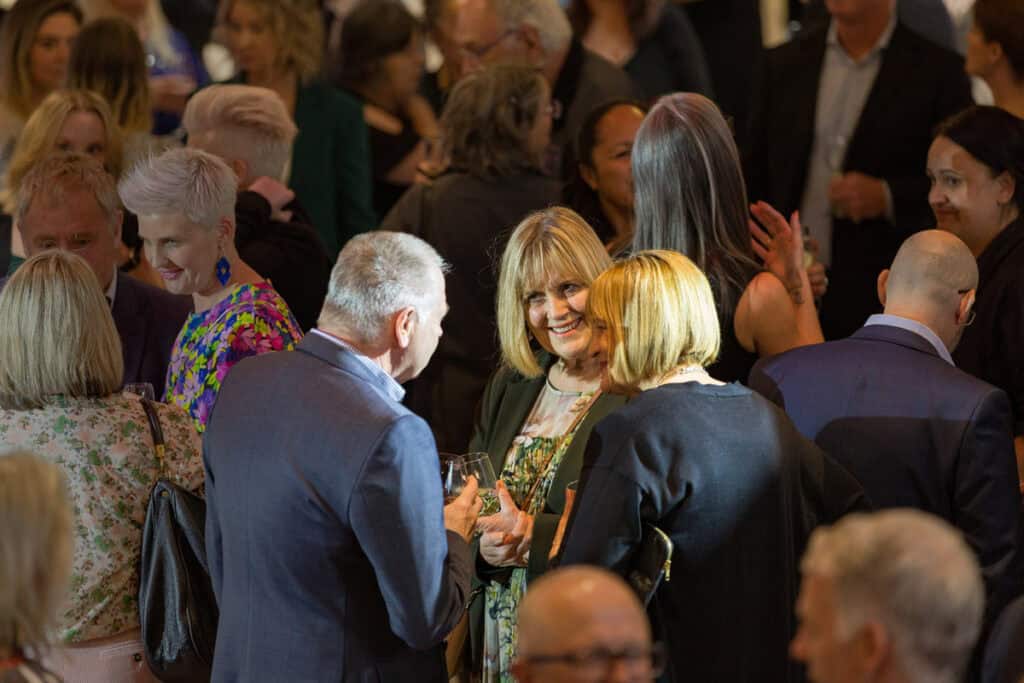
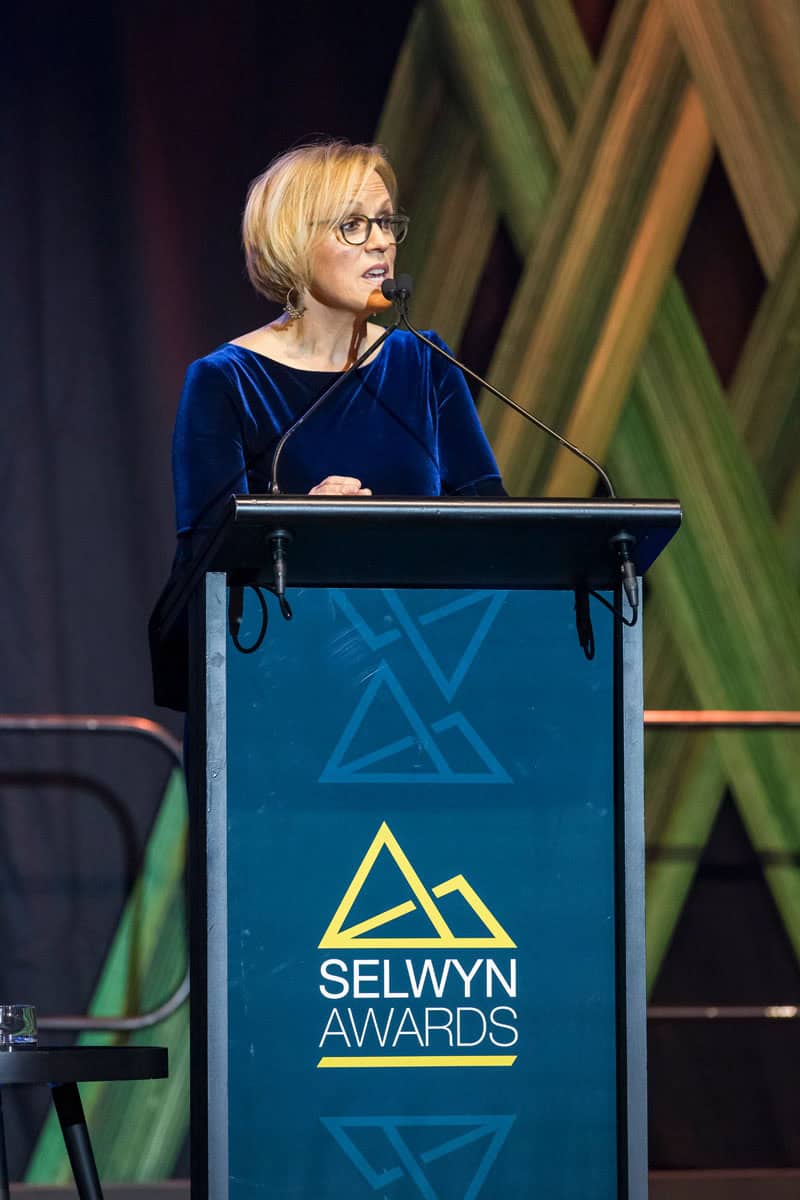
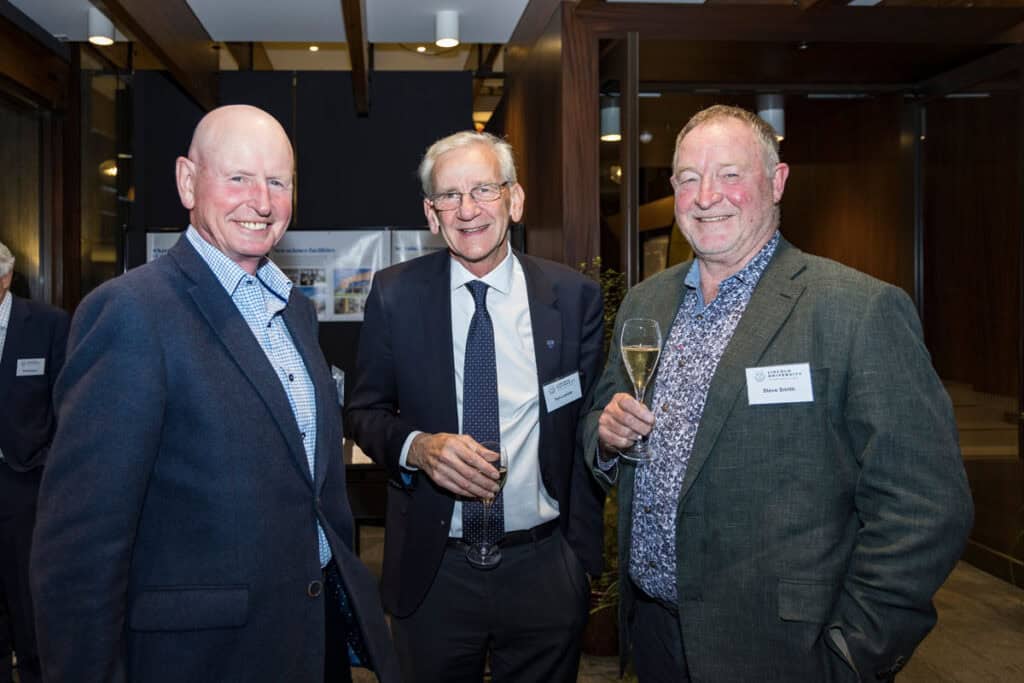
This is a really pivotal one to get right.The ability to break into groups politely, to request photos is a skill not to be underestimated. Especially if dignitaries, VIP’s and ‘busy important people’!
The skill of an experienced event photographer will come into its own right here, being able to minimise the disruption to people who would rather be socialising. While politely commanding some attention so all are looking in unison, without blinking, etc! More importantly it comes down to personality. I hope I can work with anyone, from a room full of 2yr olds, through to the Prime Minister. All will be treated respectfully, and with a smile.
Yet most dignataries, councillors, government ministers, CEO’s and the likes, are well used to being asked, and realise the importance of publicity. I must add, this is often without being seen with alcoholic drinks, so this is something I am mindful of when showcasing people at this level.
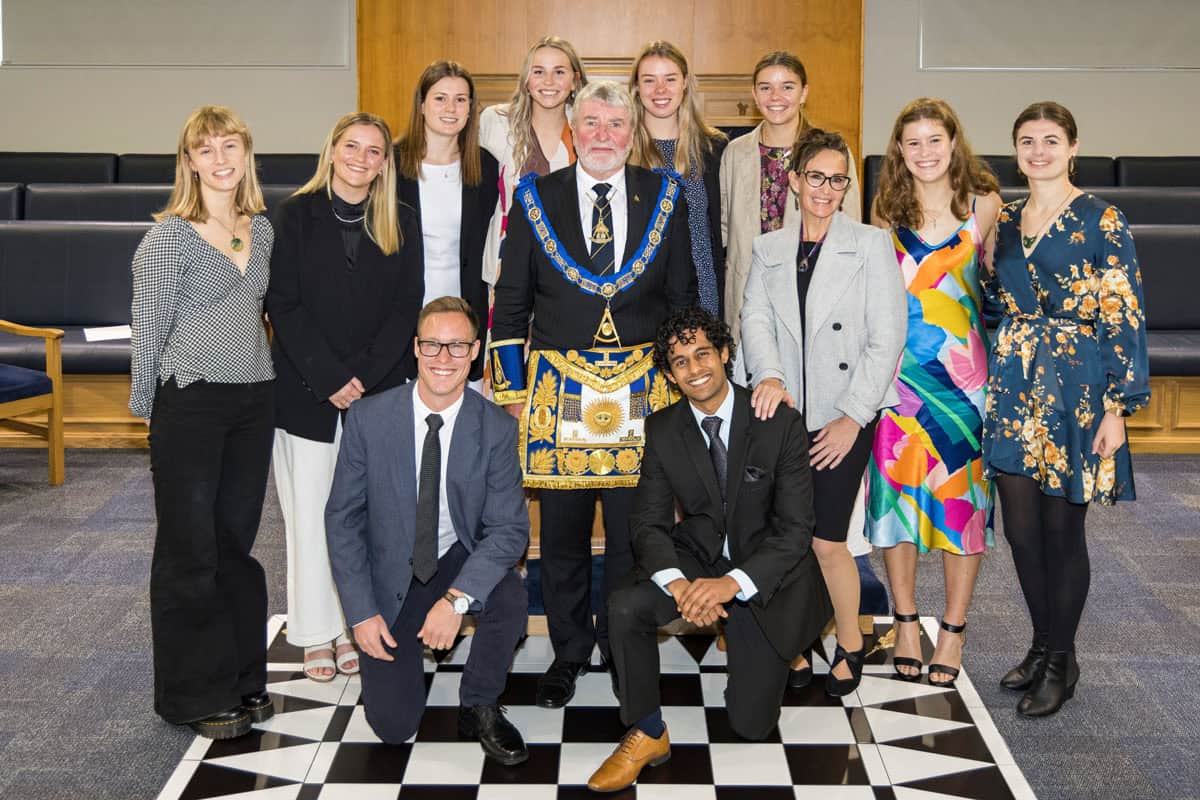
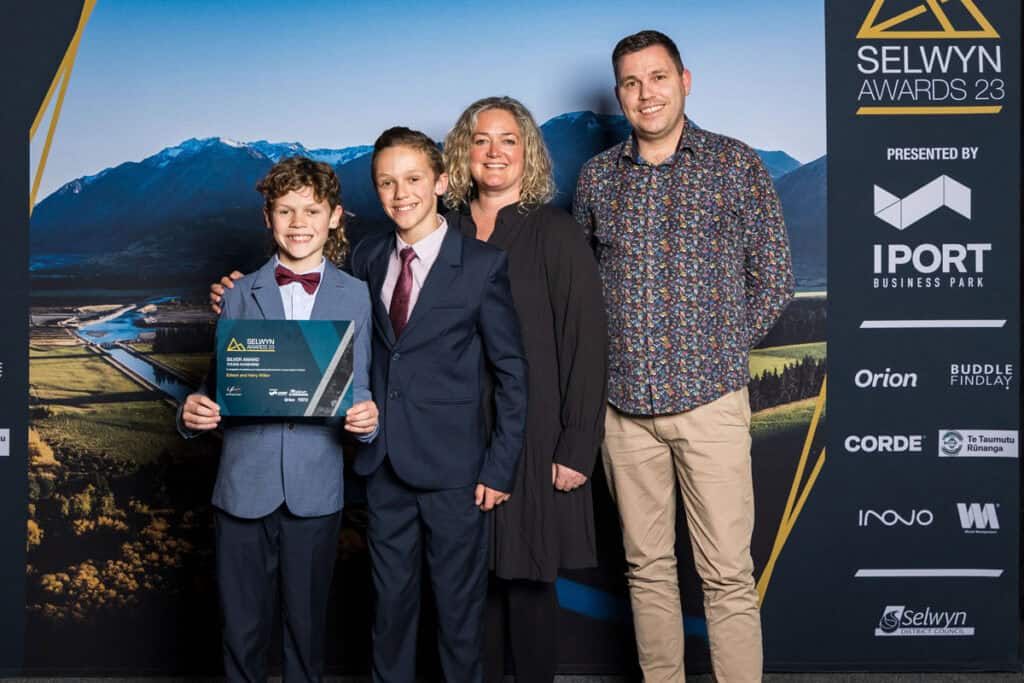
c) Capture the special awards / groups so we have all the important people, awards, VIP’s & sponsors recorded.
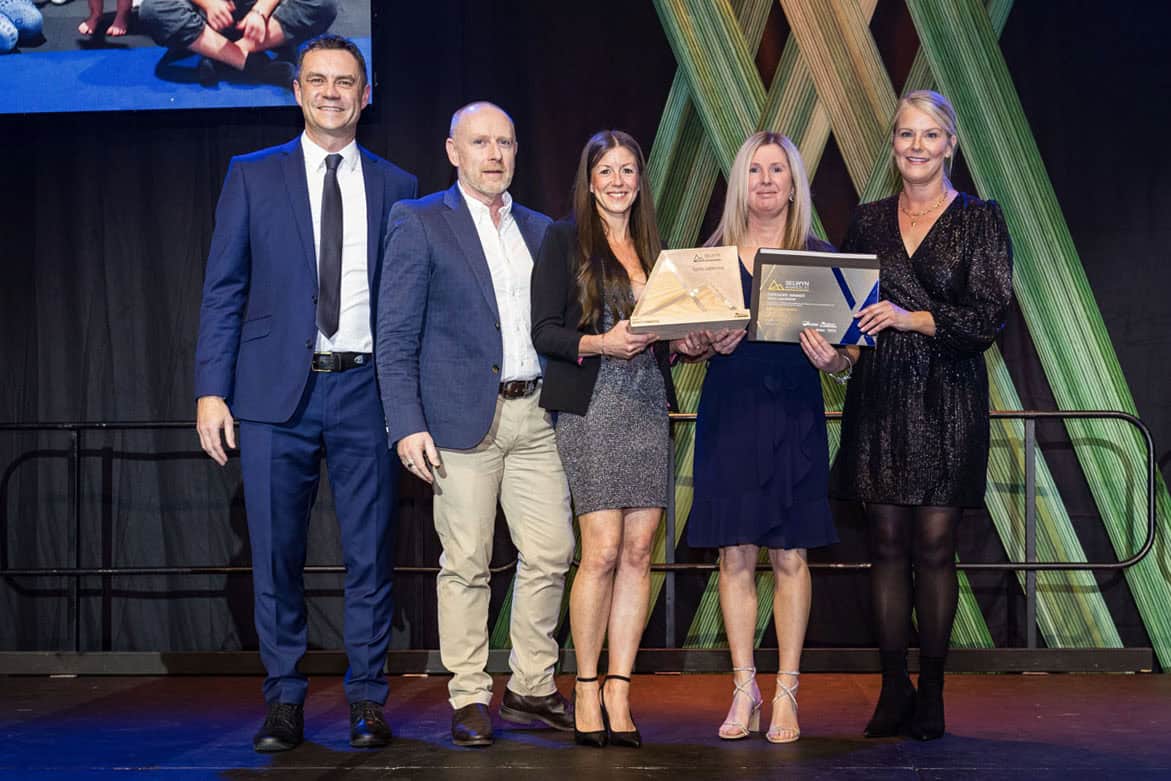
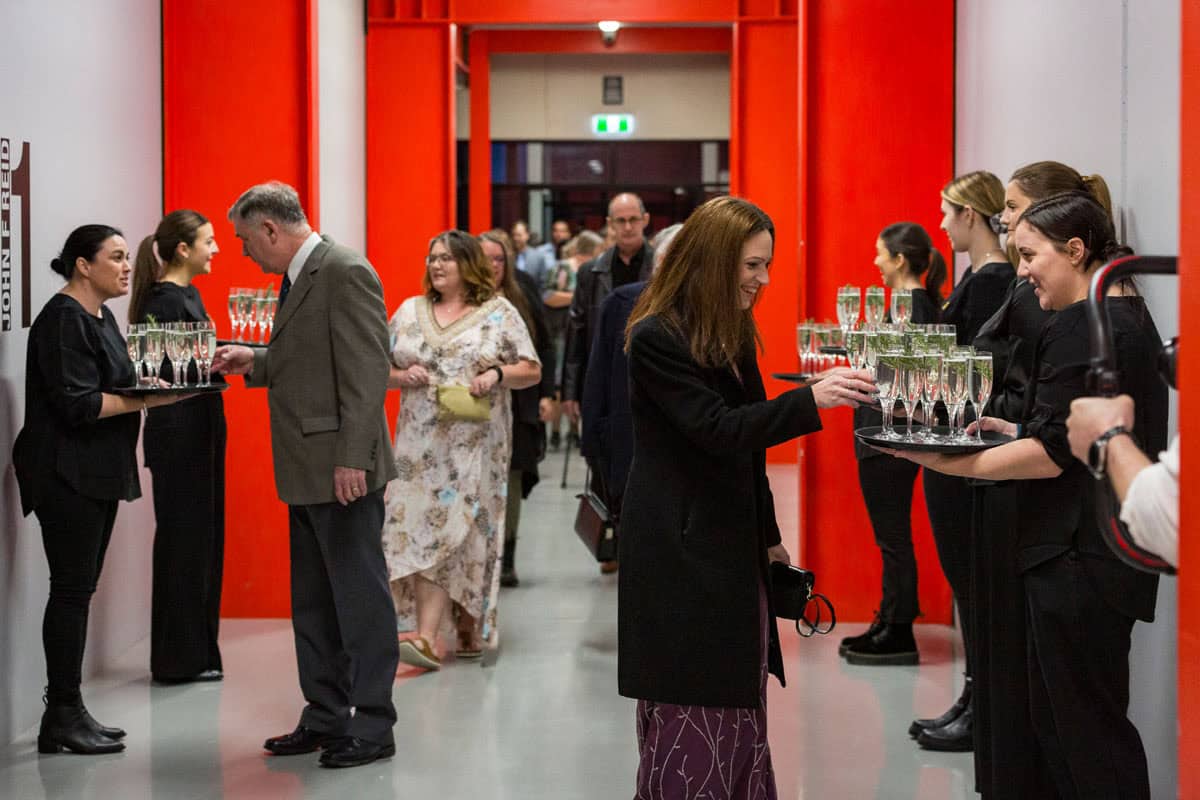
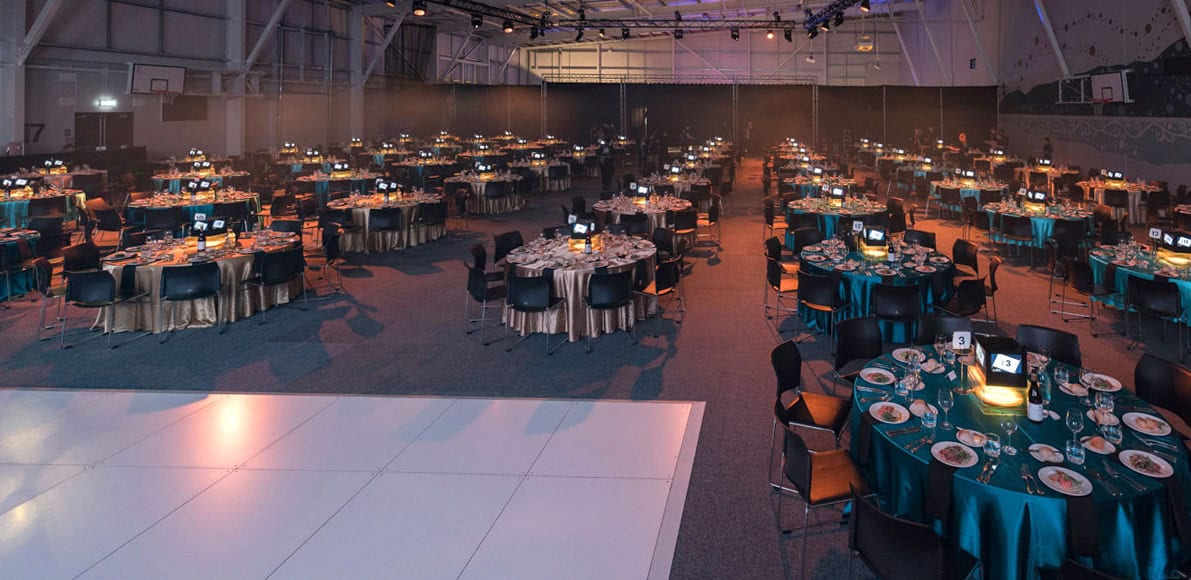
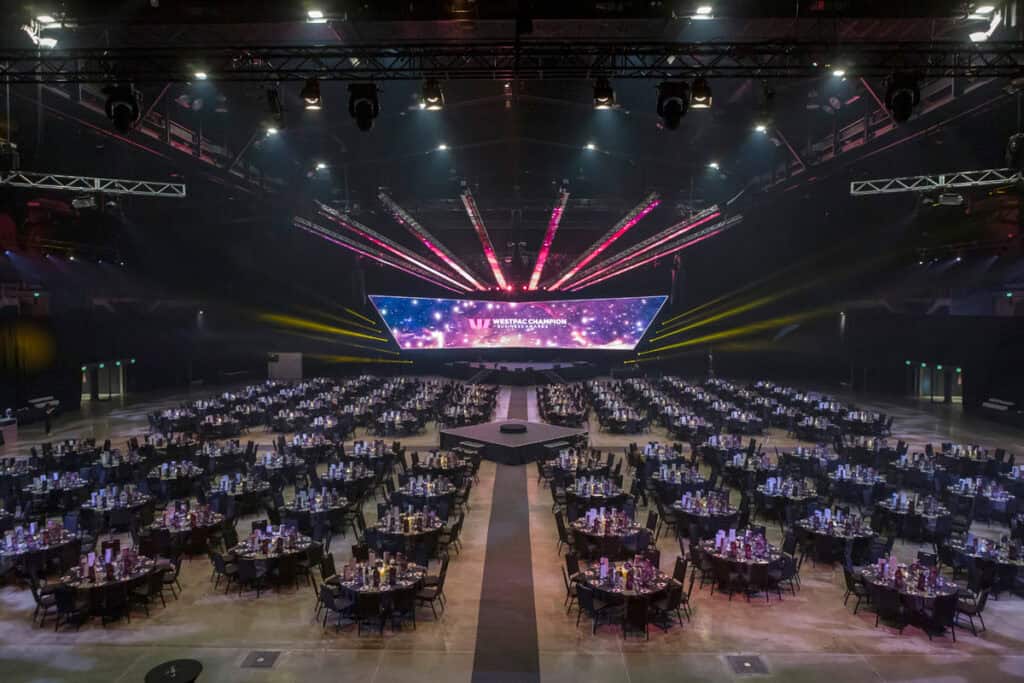
d) Detail the set up, so organisers can have that noted for future events.
Sometime too, to send as thanks to sponsors, as authentic content for future event pitches (ie next years conference), and quite often as a record for event staff planning future spaces and decor.
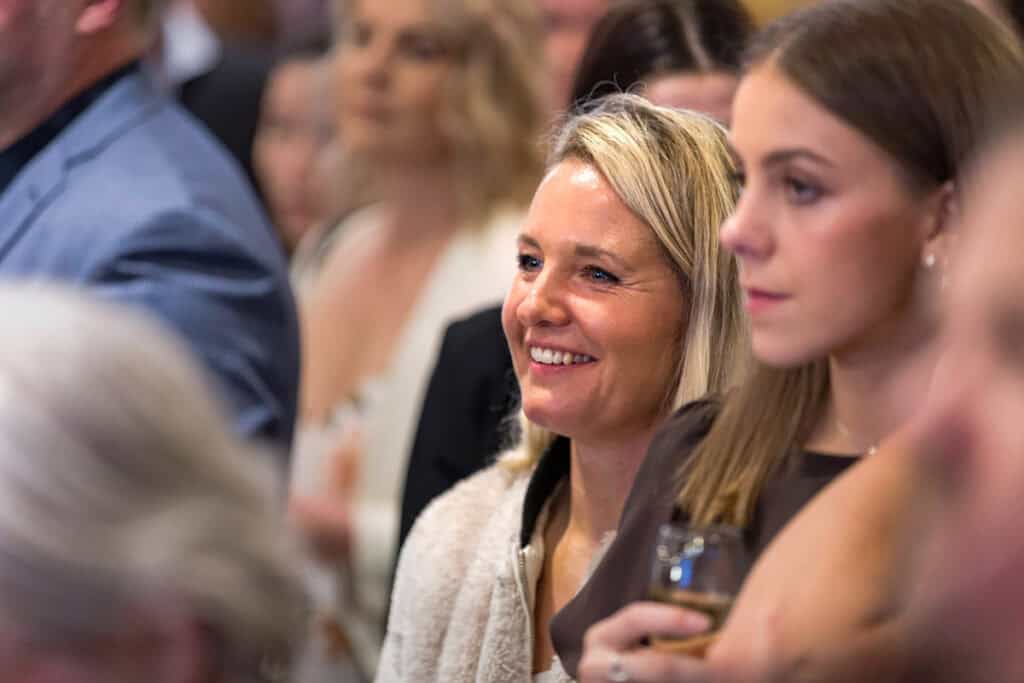
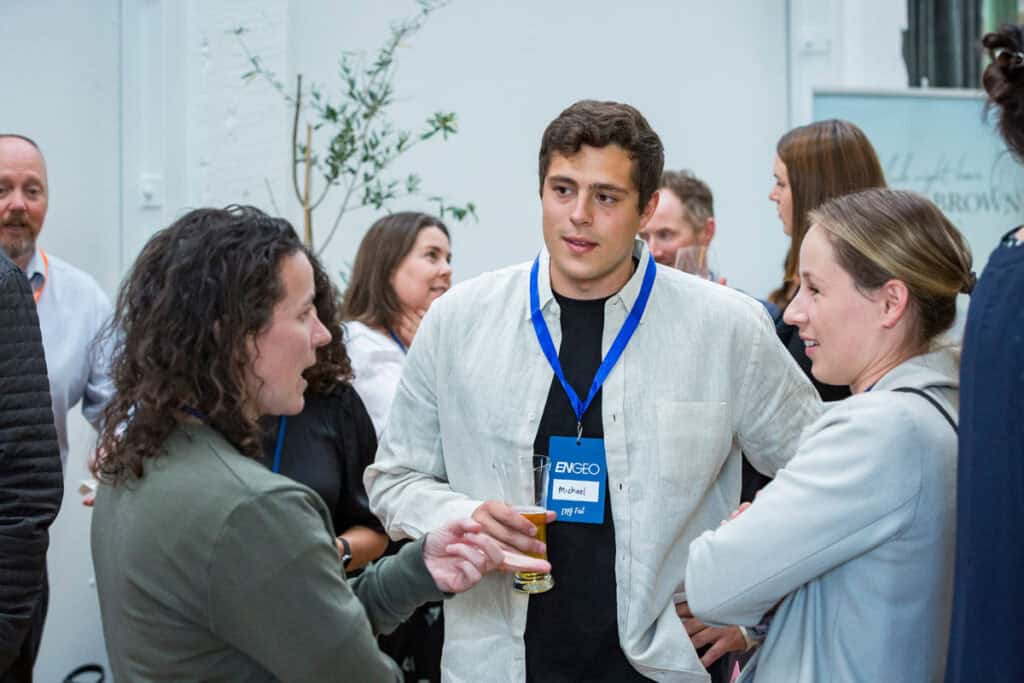
Candid or Posed?
In terms of style, it isn’t uncommon to provide a balance of candid, natural and posed. People love the idea of natural, relaxed. Which is a good job, as I tend to do both!
Key questions I always ask to assist this process are:
– is studio style lighting needing to be set up at a static base, or is coverage all roving?
– how many people / tables / awards are you anticipating?
– who are the main presenters, VIP’s and sponsors that I need to look out for?
– what do you require imagery for, and when? Social media especially will require a quick turnaround, so is always good to have that booked in my schedule as well.
– is there anybody else shooting / recording? Quite often there may be others tasked for specific requirements (ie Snapchat, real time IG, live feeds,…) so it pays not to double up.
– do you have a detailed runsheet? Luckily nearly all corporate events are professional run, and the role of a experienced event planner should never under-estimated for a successful event. Certainly a detailed timeline of events is great, knowing who is doing what, when, so I don’t miss anything,
I hope that helps outline a little about how I work in the event space, and that this may prove helpful should you be looking at how a professional photographer can add value to an event.
To see more imagery, you can click here.